Load testing tools
Organizations use load testing to predict how well their systems can handle various types of stresses. It’s a key part of building and maintaining a quality user experience, and it can only be done if you have the right tools at your disposal.
But with so many load testing tools on the market, it can be difficult to know which one to pick for your next project. Here, we’ll try to make that decision-making process easier. And while we won’t be picking winners and losers (more on this below), we will provide you with the context you need to confidently assess which tool meets your needs. And finally, we’ll walk through an example of how the shift to building and maintaining distributed applications adds to the complexity of modern load testing.
Which is the best load testing tool?
The best load testing tool is the one that best fits your specific needs. That is to say, the choice will always be subjective. Infrastructure and application demands can vary wildly, and the focus of your load testing will impact your decision.
In general, teams use load testing to see how a system responds to normal and peak usage, including how it handles the changing number of users, transactions, and data volumes. But different teams have different workflow preferences and skill sets, so look for load testing tools that have the best chances of being adopted internally. For example, a stand-alone testing team will have different priorities and perspectives than a development team that includes testing throughout the software lifecycle process. Remember, a tool may be considered best in class, but it won’t do much good if no one uses it.

Because of these varying demands, different load testing tools have been designed to address different use cases. Some tools are free. Some come with premium support. Some are geared toward QA/Test teams. Some target developers or SREs. You’ll need to decide which approach best matches your setup, but there are a few key capabilities you should look for if you’re working with more modern, dev-centric systems and teams:
- Easy to use APIs and CLI. Choose tools designed to be intuitive, flexible, and powerful — all in an interface that’s familiar to developers.
- Support for familiar scripting languages. Make it easier to build realistic tests by enabling teams to write in popular languages, such as Javascript. That way, you can also reuse modules and libraries to better build and maintain your test suite.
- Automated testing. By integrating performance tests with your CI/CD tooling, you can set up pass-fail criteria to easily see if you’re meeting your reliability goals. This data can then be used to keep tabs on service level objectives (SLOs).
- High performance. If you want to see how your application responds to a huge spike in traffic, the load testing tool needs a powerful engine. You should be focused on how your system handles load, not how well your tool can generate it.
- Scalability. Look for load testing tools you can use to build and debug whether you’re running tests on a local machine, in a distributed cluster, or in the cloud.
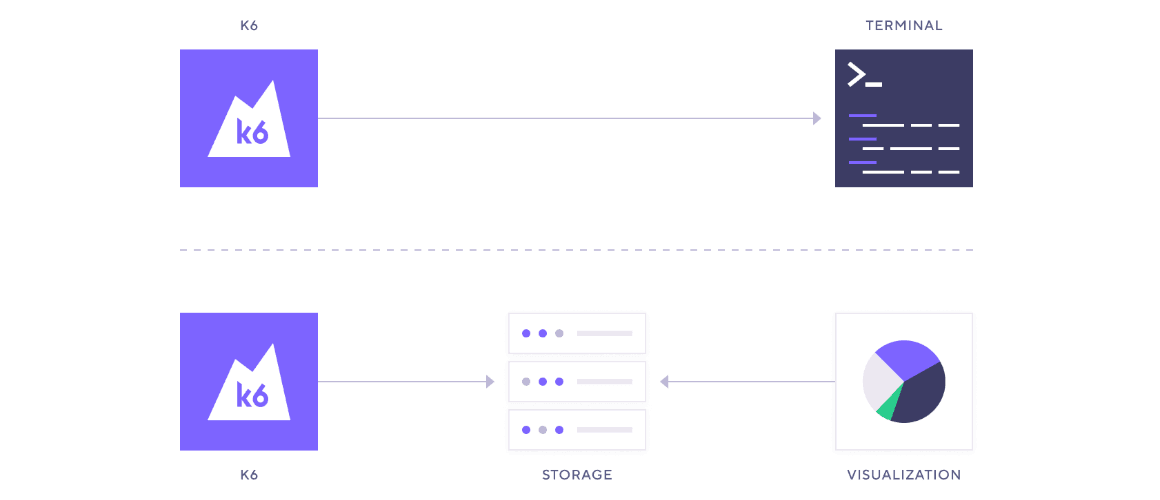
- Support for your preferred data store. Can you send metrics from your load testing tool to your preferred backend for storage and further analysis? What if different teams use different backends? Make sure to confirm you have the necessary flexibility in this regard.
- Extensibility. Plugins for popular infrastructure elements such Kubernetes, SQL, and MQTT can greatly expand the potential use cases for your load testing tools.
By focusing on these factors, you should be better positioned to identify performance issues, ensure reliability, optimize performance, deliver a great UX, and meet SLOs.
Load testing tools: open source
At Grafana Labs, open source is at the heart of everything we do, so we see lots of benefits in using open source tooling for load testing. For starters, it can be more cost effective since there aren’t any licensing or support fees to worry about. It’s also much easier to get started — just install the software and get testing.
Additionally, many open source tools can send the results to a backend for you to create visualizations later with a third-party analytics tool. And if you don’t like the tool, you can drop it at any time and you won’t have to worry about how you get your data back.

In terms of use cases, an open source load testing tool can be a great, cost-effective way to build a proof of concept. From there, you can incorporate capabilities that go beyond basic load testing. Open source tools can also work well for small teams working on simple, infrequent tests.
Because of the demand for open source alternatives, there are multiple projects that continue to drive community interest. Here are 10 of the most popular open source load testing tools, listed alphabetically:
- ApacheBench
- Apache JMeter
- Artillery
- Gatling
- Grafana k6
- Locust
- Siege
- Taurus
- The Grinder
- Tsung
Is JMeter a load testing tool?
Apache JMeter is one of the most popular load testing tools and has been for some time. First released in 1998, the open source project garnered interest because it was a free alternative to expensive, proprietary tools that previously dominated the market.
The Java application simulates varying types of load so you can see the potential impact on your system performance. Testers can have their scripts executed using code, but most scripting in JMeter is done in the UI.
JMeter excels in many areas. It’s GUI-driven, which is often less daunting and easier to start with for those used to no-code interfaces. That design also makes it well suited as an alternative for commercial tools like LoadRunner and NeoLad. Plus, JMeter works natively with many different protocols, including HTTP, REST APIs, FTP, LDAP, TCP, and it provides a framework for running distributed load tests.
But as we discussed already, different teams have different needs. For example, Grafana k6, which is also open source, might be more appealing for those looking for a tool that’s simple and lightweight. k6 would also be a better fit for collaborative, cross-functional engineering teams where multiple roles conduct tests, as well as teams that want to integrate load testing into their dev workflows or CI/CD pipelines.
Load testing tools: free vs. commercial
Despite the many benefits of open source load testing tools, it’s not for everyone. For example, teams should consider robust solutions when they need to:
- Run large tests or distribute the test execution across multiple machines.
- Do continuous performance testing.
- Allow different roles to participate in the testing.
- Track and report app performance and reliability over time.
- Improve the solution’s reliability and usability.
At a certain scale, the efforts that go into maintaining and scaling load tests outweigh the benefits. If you don’t have the resources needed to run and maintain your own testing tool at scale, consider partnering with a commercial vendor so you can focus on what’s core to your business.
Of course, it doesn’t have to be an either-or choice. Many organizations use a mix of open source and commercial tools to address their load testing needs. Regardless, make sure to calculate the total cost of ownership for your various options before making any tool a pillar of your load testing strategy.
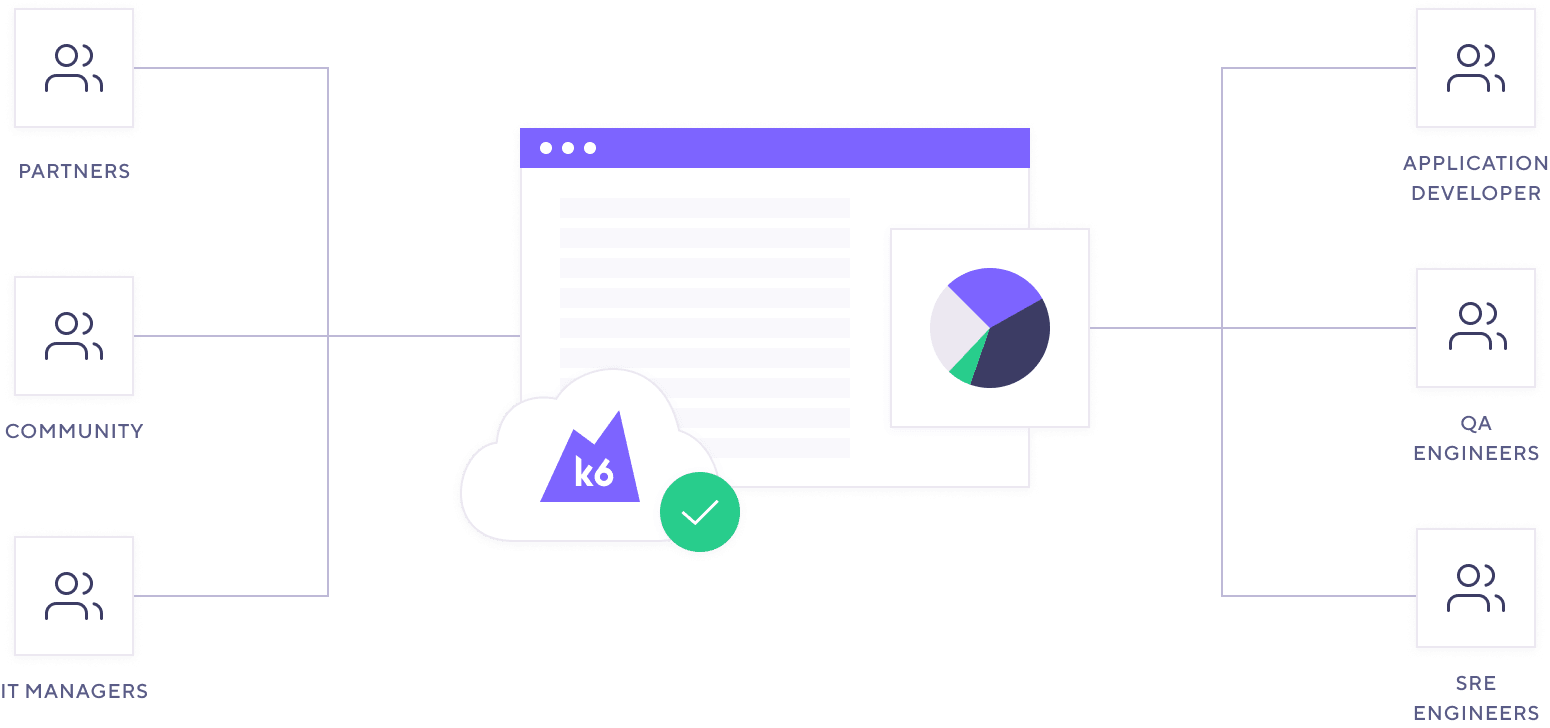
And be sure to identify the teams that will use the tool. For example, QA testers, developers, site reliability engineers (SREs), and others will likely play a role in load testing for your organization.

Here are 10 of the most popular paid load testing solutions, listed alphabetically:
- Akamai CloudTest
- BlazeMeter
- Grafana Cloud k6
- Headspin
- LoadRunner
- LoadNinja
- LoadView
- NeoLoad
- New Relic
- Radview WebLOAD
Load testing tools for APIs: testing example
APIs have become the foundation of modern software, enabling communication between different computer programs. But because they’re used by multiple services, the load on those APIs can be variable and hard to predict. Let’s look at load testing for APIs and how that’s reflective of the larger benefits and challenges involved in load testing today’s systems.
First, let’s highlight the benefit of API load testing: Teams that load test their APIs can improve load times and overall performance. They can also reduce the risk of failures and help lower costs by avoiding outages and operating more efficiently. There are even tools designed with API load testing in mind, including BlazeMeter, Grafana k6, JMeter, Postman, and Taurus, just to name a few.
Typically, an API load test starts by assessing small, isolated components. With each corresponding iteration, the tests are broadened until they get a more complete, end-to-end perspective on the API’s workflow, and, potentially, how it interacts with other APIs. This includes adding more requests, over longer durations, and expanding the overall scope of the test until you feel you have a comprehensive understanding of how the API(s) will respond to various stresses.
When you design your API tests, you should consider:
- The flows or components you want to test
- How you plan to run the test
- The criteria for acceptable performance
Once you figure that out, an API testing strategy would usually follow these steps:
- Script the test. Write user flows, parameterize test data, and group URLs.
- Assert performance and correctness. Use checks to assert system responses and use thresholds to ensure that the system performs within your SLOs.
- Model and generate load. Choose the executors to correctly model the workload that’s appropriate to your test goals. Make sure the load generators are located where they should be.
- Iterate over your test suite. Over time, you’ll be able to reuse script logic (e.g., a user log-in flow or a throughput configuration). You’ll also be able to run tests with a wider scope or as a part of your automated testing suite.
Next, we’ll use k6 to look at specific explanations and examples of the steps in this process. If you’ve scripted tests before, k6 scripts should seem familiar. k6 tests are written in JavaScript, and the k6 API design is similar to other testing frameworks.
Identify test components
As we discussed previously, you want to start small, so first we’ll test a single endpoint with the following script, which uses the k6 HTTP module.
import http from 'k6/http';

export default function () {
  const payload = JSON.stringify({
    name: 'lorem',
    surname: 'ipsum',
  });
  const headers = { 'Content-Type': 'application/json' };
  http.post('https://httpbin.test.k6.io/post', payload, { headers });
}
From here you can progress to testing more complex, complete workflows, going from an isolated API to integrated APIs to end-to-end API flows.
Determine the reason for the test
Don’t configure your load test until you understand the traffic patterns you’re testing for. Are you trying to validate reliability under typical traffic, or discover problems and system limits for spikes? The answer will help determine the type of load test you should run. For example, you might use a smoke test to verify system functions with minimal load, while you’d use a soak test to determine system degradation when loads run for longer periods.
Model the workload
In k6, you can model load through:
- virtual users (VUs), to simulate concurrent users
- requests per second, to simulate raw, real-world throughput
You can define these options in the test script. In the following test, 50 concurrent users continuously run the default flow for 30 seconds.
import http from 'k6/http';

export const options = {
  vus: 50,
  duration: '30s',
};

export default function () {
  const payload = JSON.stringify({
    name: 'lorem',
    surname: 'ipsum',
  });
  const headers = { 'Content-Type': 'application/json' };
  http.post('https://httpbin.test.k6.io/post', payload, { headers });
}
If you want to analyze API endpoint performance, the load is generally reported by request rate — either per second or per minute.
To configure workloads according to a target request rate, use the constant arrival rate executor, which sets a constant rate of iterations that execute the script function. Each iteration can generate one or multiple requests.
To reach a request-rate target (RequestsRate):
- Set the rate frequency
- Get the number of requests per iteration (
RequestsPerIteration) - Set the iteration rate to the requests per second divided by the number of requests per iteration.
rate=RequestsRate÷RequestsPerIteration.
To reach target of 50 reqs/s with the previous example:
Set the
timeUnitoptions to 1s.The number of requests per iteration is 1.
Set the
rateoption to 50/1 (so it equals 50).import http from 'k6/http'; export const options = { scenarios: { my_scenario1: { executor: 'constant-arrival-rate', duration: '30s', // total duration preAllocatedVUs: 50, // to allocate runtime resources preAll rate: 50, // number of constant iterations given `timeUnit` timeUnit: '1s', }, }, }; export default function () { const payload = JSON.stringify({ name: 'lorem', surname: 'ipsum', }); const headers = { 'Content-Type': 'application/json' }; http.post('https://httpbin.test.k6.io/post', payload, { headers }); }This test outputs the total number of HTTP requests and RPS on the
http_reqsmetric:# the reported value is close to the 50 RPS target http_reqs......................: 1501 49.84156/s # the iteration rate is the same as rps, because each iteration runs only one request iterations.....................: 1501 49.84156/sVerify functionality
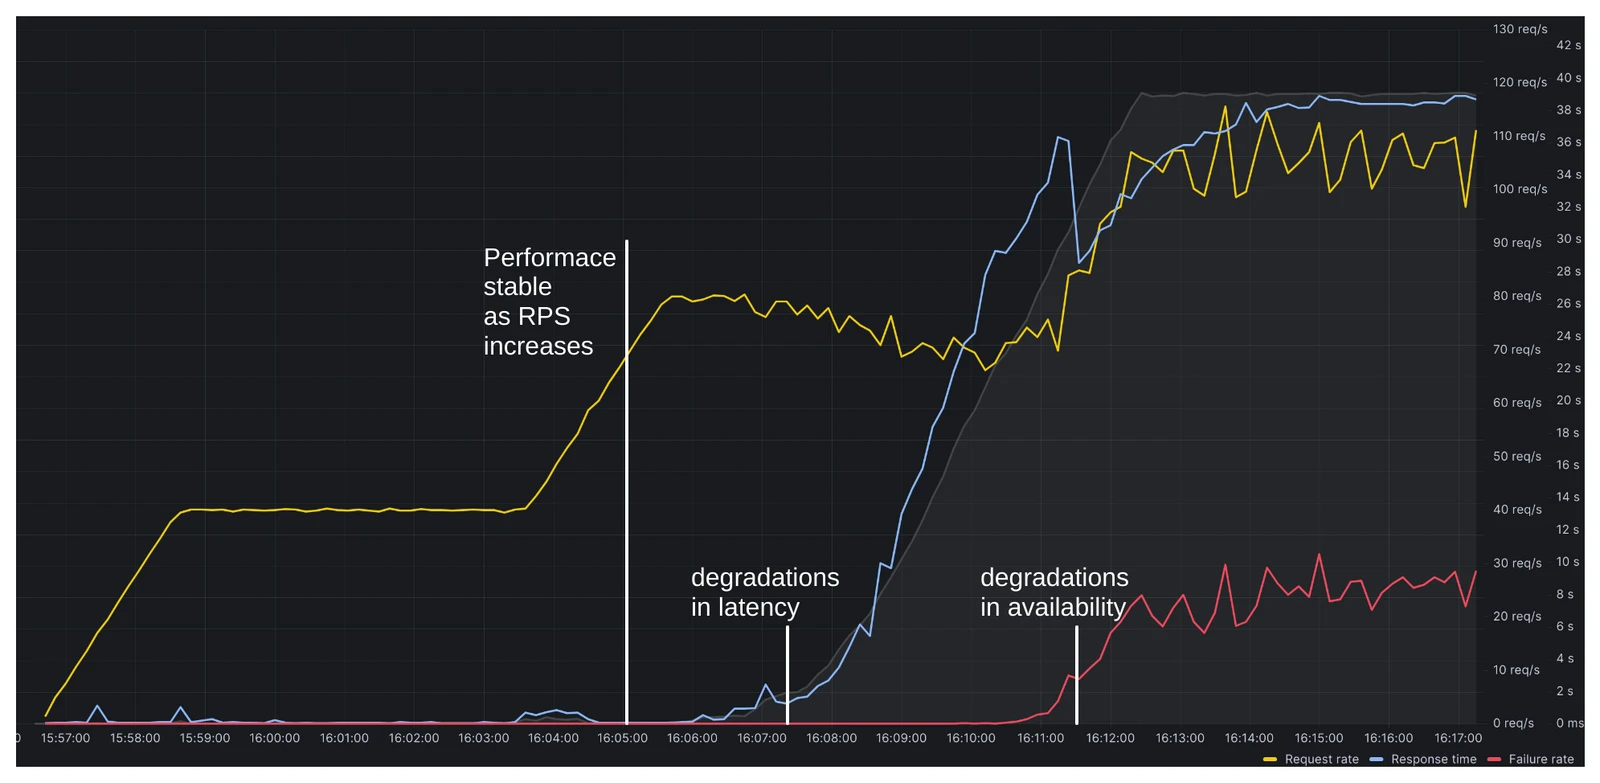
Latency and availability are typically the two key metrics for performance tests. The
http_req_durationmetric reports the latency, andhttp_req_failedreports the error rate for HTTP requests. The previous test run provided the following results:http_req_duration..............: avg=106.14ms min=102.54ms med=104.66ms max=198.93ms p(90)=113.78ms p(95)=114.58ms { expected_response:true }...: avg=106.14ms min=102.54ms med=104.66ms max=198.93ms p(90)=113.78ms p(95)=114.58ms http_req_failed................: 0.00% ✓ 0 ✗ 1501You might also want to validate functionalities and report errors. For example, some application failures only occur under certain load types, such as high traffic. These errors are hard to find, but you can find them if you instrument your APIs and verify that requests get the expected responses.
In k6, checks validate conditions during the test execution, so you can use them to confirm expected API responses, such as the HTTP status or any returned data.
Our script now verifies the HTTP response status, headers, and payload.
import { check } from 'k6';
import http from 'k6/http';

export const options = {
  scenarios: {
    my_scenario1: {
      executor: 'constant-arrival-rate',
      duration: '30s', // total duration
      preAllocatedVUs: 50, // to allocate runtime resources

      rate: 50, // number of constant iterations given `timeUnit`
      timeUnit: '1s',
    },
  },
};

export default function () {
  const payload = JSON.stringify({
    name: 'lorem',
    surname: 'ipsum',
  });
  const headers = { 'Content-Type': 'application/json' };
  const res = http.post('https://httpbin.test.k6.io/post', payload, { headers });

  check(res, {
    'Post status is 200': (r) => res.status === 200,
    'Post Content-Type header': (r) => res.headers['Content-Type'] === 'application/json',
    'Post response name': (r) => res.status === 200 && res.json().json.name === 'lorem',
  });
}
In this snippet, all checks succeeded:
my_scenario1 ✓ [======================================] 00/50 VUs  30s  50.00 iters/s
     ✓ Post status is 200
     ✓ Post Content-Type header
     ✓ Post response name
After the load increased to 300 requests per second, the results returned 8811 successful requests and 7 failures:
my_scenario1 ✓ [======================================] 000/300 VUs  30s  300.00 iters/s
     ✗ Post status is 200
      ↳  99% — ✓ 8811 / ✗ 7
     ✗ Post Content-Type header
      ↳  99% — ✓ 8811 / ✗ 7
     ✗ Post response name
      ↳  99% — ✓ 8811 / ✗ 7
By default, a failed check doesn’t fail or abort the test, and some level of failure is acceptable, depending on your error budget.
An easier way to get started
Grafana Cloud is the easiest way to get started with metrics, logs, traces, and dashboards. We have a generous forever-free tier and plans for every use case.
