

OpenTelemetry metrics: A guide to Delta vs. Cumulative temporality trade-offs
In OpenTelemetry metrics, there are two temporalities, Delta and Cumulative and the OpenTelemetry community has a good guide on the different trade-offs of each. However, the guide tackles the problem from the SDK end.
It does not cover the complexity that arises from the collection pipeline. This post takes that into account and covers the architecture and considerations that are involved end-to-end for picking the temporality.
What is temporality in OpenTelemetry?
For data points, temporality refers to how additive measurements are reported in relation to time. More specifically it addresses whether reported values incorporate previous measurements or not.
- Cumulative temporality means that the value will be the overall value since the start of the measurement.
- Delta temporality means that the value will be the difference in the measurement since the last time it was reported.
For example, a Cumulative counter measuring the number of requests handled would look like:
[t0, 5], [t0+10, 10], [t0+20, 20], [t0+30, 40], [t0+40, 45]The same measurement as a Delta counter would only report the difference between the last value:
[t0, 5], [t0+10, 5], [t0+20, 10], [t0+30, 20], [t0+40, 5]Application architecture
The typical architecture that we’re targeting here is that the applications generate the metrics and export them to the OpenTelemetry Collector in the OTLP format and the Collector then forwards these metrics to the relevant backend.
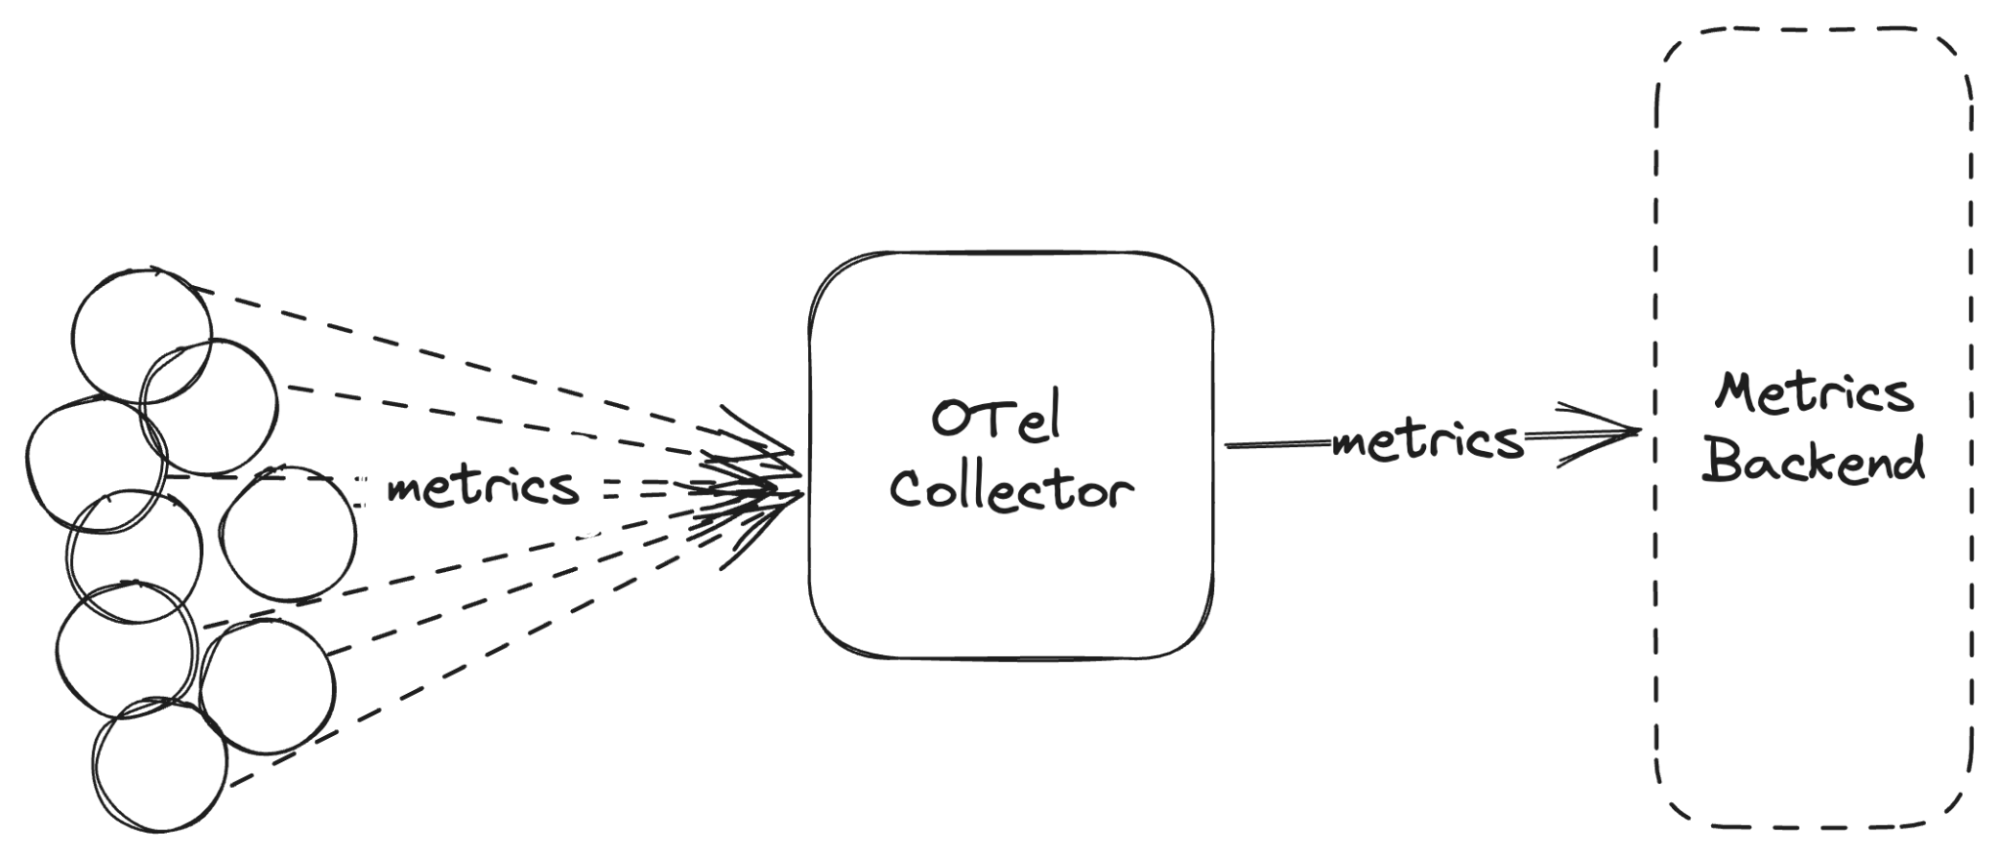
We will not discuss the architecture where the applications push directly to the backend. This is not recommended in production.
Backend considerations
Now, one of the best indicators for determining which temporality to pick is what the backend supports. Some backends only support Cumulative, but some backends work better with Delta temporality. Some backends support both. The best option is to pick the temporality that is preferred by the metrics backend you’re using. (For example, Prometheus and Grafana Mimir support Cumulative temporality.)
You configure the temporality in the applications themselves, and if you have to switch temporality, you would need to reconfigure and restart your applications. This might not work for you, especially if you want to send metrics to multiple backends with different temporality preferences, or if you would like to switch backends without changing anything in the applications.
Reliability considerations
When you push Delta metrics, dropped samples mean data loss. In Cumulative mode, dropped samples mean a loss of resolution in time. All counter increments and all observations tracked in a histogram are still accounted for over a longer time frame.
Converting temporalities
This is where the OpenTelemetry Collector comes in. You can instrument your code in one of the temporalities, but you can export it to the backend in a different temporality by using the Collector to convert.
Convert Cumulative to Delta temporality
There is a Cumulative to Delta processor in the Collector that lets you ingest Cumulative metrics but convert them to Delta temporality metrics. It’s quite easy to use it, but scaling this setup is not trivial.
Converting from Cumulative to Delta would require knowing the previous value of the metric, and this requires that the same metrics end up in the same Collector. There are strategies to handle this, by deploying a side-car container (too expensive, IMO) or by deploying a daemonset with node-local service.
When using a standard Collector deployment, there is a similar use case when doing tail-sampling where we need to send the spans of the same traceID to the same collector. The load-balancing exporter can do this, and they just merged support for metrics, which would allow us to scale the Collector cluster!
Convert Delta to Cumulative temporality
Converting from Delta to Cumulative isn’t possible today via a processor in the Collector. However, several exporters do support Delta to Cumulative conversion in the exporter itself, such as the Prometheus Exporter. There are also ideas for making the Delta to Cumulative functionality an “exporter helper,” so any exporter that needs Cumulative metrics can easily and automatically support Delta metrics as well.
However, this conversion runs into the same issue regarding scaling and requires the same support in the load-balancing exporter.
Addressing the out-of-order problem
When I wrote a doc about the OTel to Prometheus usage issues, I naively described the conversion of Delta to Cumulative as “straightforward.” Things get complicated, though, when you’re dealing with out-of-order writes. For example, let’s take a metric which has a cumulative value of 100 at t=5000. If we see a Delta value of 5 come in at t=5050, we can then insert a new point whose Cumulative value is 105 at t=5050. However, if we then see a Delta data point come in with a timestamp of t=4950, then we would need to change the values stored at t=5000 and t=5050. Overwriting older data might be an expensive operation in TSDBs (like Prometheus).
One suggestion on how to handle this without overwriting is to only expose the Cumulative value at a 60-second delay. This way, we have a 60s buffer window to aggregate the deltas. We still won’t be able to handle the Delta values that are delayed for more than 60s, but it should cover the majority of the data points.
Addressing the dropped points problem
Now, even if we can fix the scalability issue, converting from Delta to Cumulative would mean we need every single delta data point to get accurate results. If the collector goes down for a few mins, we lose the data for that time range. This is an inherent problem with Delta temporality.
This is less of a problem with Cumulative metrics, because we get the Cumulative value, and can find an average Delta for the missing time-range.
Aggregation of time series
A common operation in the ingestion pipeline is to aggregate away unnecessary cardinality.
How it works with Delta temporality
Doing this in Delta temporality is quite easy. You just need to strip the label away and send the value down, or you can just aggregate the relevant values in the specific time window.
How it works with Cumulative temporality
Doing this in Cumulative temporality gets trickier as you need to track and account for the underlying series.
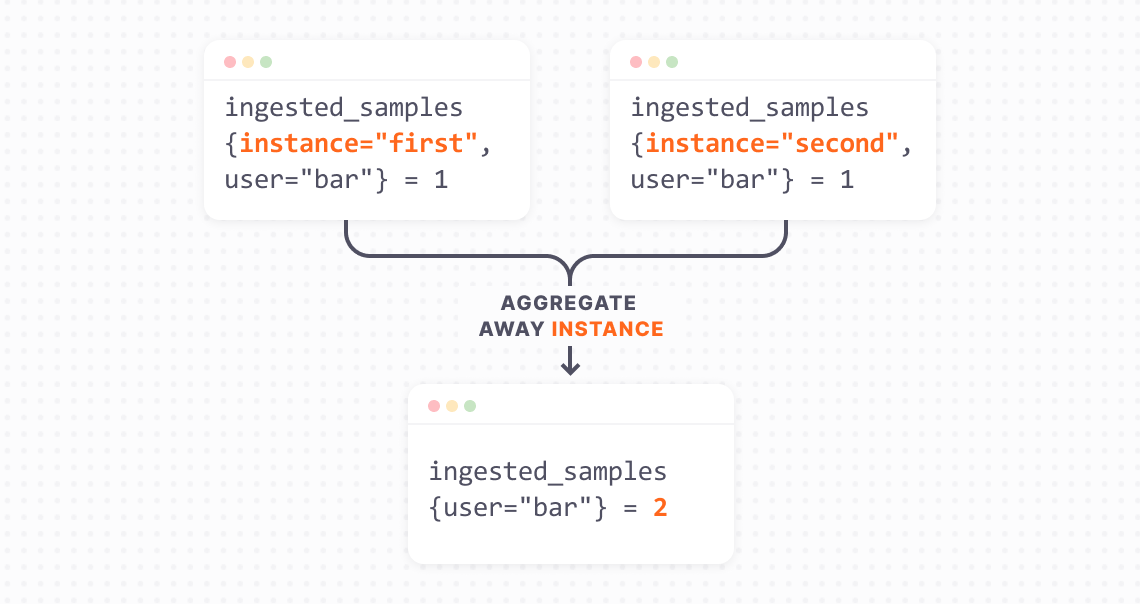
For example, from the above example, if you have two series ingested_samples{instance="first", user="bar"} 1 and ingested_samples{instance="second", user="bar"} 1. The aggregated series would be: ingested_samples{user="bar"} 2.
Now, if the first metric ingested_samples{instance="first", user="bar"} 1 stops being sent, we still need to output a value of 2 in the aggregated metric. To do this reliably means we would need to store the series we’ve seen before and the we haven’t seen.
In Grafana Cloud’s Adaptive Metrics feature, we implemented aggregations over Cumulative temporality to abstract away the complexity for you.
Memory usage in the application
The OpenTelemetry docs call out how Cumulative temporality is likely to take more memory than Delta. This is only true for Synchronous Instruments. This is because we need to remember every combination of the metric and label sets ever seen, while in Delta, we only need to remember the metrics seen in between exports.
For Asynchronous Instruments, Cumulative temporality takes less memory. You can see a good explanation of this in the Aggregation temporality supplemental guidelines.
Pruning old metrics
If you’re counting all possible metrics over a long period of time, you will end up with a lot of stale metrics, which will take up memory unnecessarily. Prometheus SDKs let you manage only the active metrics and prune the old ones.
For example, in Grafana Mimir, we count and expose the number of active series on a per-tenant basis. As we run a SaaS service with a free tier (check out Grafana Cloud’s free-forever plan), we have a lot of users who try our service. If we don’t manage to prune the metrics, we will be constantly tracking an increasing number of metrics that will eventually take up a lot of memory. But this doesn’t happen. Only the active tenants have their metrics exposed, and we stop exporting the metric for a user when we remove their data from memory.
Prometheus SDKs provide a mechanism to manage only active metrics, through custom collectors, and it is heavily used in larger applications. OpenTelemetry SDKs allow this through Asynchronous Instruments.
One big advantage of Delta is that it is really hard to cause a memory leak. Adding more and more metrics isn’t allowed through Asynchronous Instruments, and Synchronous Instruments don’t need pruning.
How much memory though?
The Prometheus SDKs use Cumulative temporality internally, and we’ve seen that memory utilization is not really a problem for most use cases. For example, one of our services exposes 32,000 metrics, and looking at its heap-profile shows that the metrics are taking 9.58MB, which is coming to around 300B per metric.
Now, 32,000 metrics out of a single pod is a lot, and at 10MB, it’s not a big deal for most applications. I expect the OpenTelemetry SDK Cumulative metric memory consumption to be similar.
Note: Summary metrics in Prometheus do take up a lot of memory. But OpenTelemetry SDKs don’t have a similar instrument type in them.
Low memory mode of SDK
However, if you’re running in a super memory constrained environment, you can use the low memory mode of the SDK, which uses Delta temporality for Synchronous Instruments and Cumulative temporality for Asynchronous Instruments. This is the most memory efficient mode for each of the instrument types.
Making Delta temporality work in Prometheus
I opened an issue in Prometheus to support Delta metrics from OTLP. I don’t think actually storing the Delta data points is a good fit for the data model or the query language, but if we can convert from Delta to Cumulative before storing the metrics, it will work (with the 60s delay detailed above).
I do want some level of Delta support in Prometheus, which will help to support AWS Lambda and serverless use cases. When you spin up and shutdown a lot of serverless processes, assigning each an instance-id would cause an explosion of cardinality. What would work is if each application pushes Delta metrics that are aggregated into a Cumulative metric in Prometheus.
Final thoughts on temporality in OpenTelemetry
Finally, considering all this, I believe that the best temporality to pick is the one supported by your backend. While you can convert from one temporality to another, it’s not trivial to scale, and has fundamental issues that are hard to solve. I would be wary of “low-memory” mode, unless your backend has good support for both Cumulative and Delta. The practical advantage it provides is not worth it for most use cases.
If your backend supports both Cumulative and Delta, I would recommend using Cumulative because it will be more resilient to missing/dropped data points, and a simplified ingestion pipeline.
Thanks a lot to David Ashpole, Josh MacDonald, Juraci Paixão Kröhling and Björn Rabenstein for their inputs and reviews on this post.
Grafana Cloud is the easiest way to get started with metrics, logs, traces, and dashboards. We have a generous forever-free tier and plans for every use case. Sign up for free now!


