

5 reasons why OVHcloud migrated its time series data to Grafana Mimir
A sysadmin in the high performance computing world since 2008, Wilfried Roset is now working with the open source databases and observability environment at OVHcloud. He leads a team focused on building industrialized, resilient, and efficient solutions.
For nearly two decades, OVHcloud has been a leader in cloud hosting and has been Europe’s largest provider since 2011. To serve our 1.4 million customers globally, we need a reliable and scalable observability platform.
In our search for a resilient infrastructure solution, a major focus was finding an option that could provide remote storage for our operational and business critical metrics. As we quickly learned, assessing our technical choices and evaluating the appropriate backend changes for the business is a time-intensive process. But in the end, we chose Grafana Mimir over every other tool.
I wrote about the entire migration to Mimir — from proof of concept to execution – on the OVHcloud blog. But in this blog post, I wanted to share our methodology and approach to choosing Grafana Mimir so that others can take away the top lessons that we learned in our metrics migration process.
What is remote storage and why is it important?
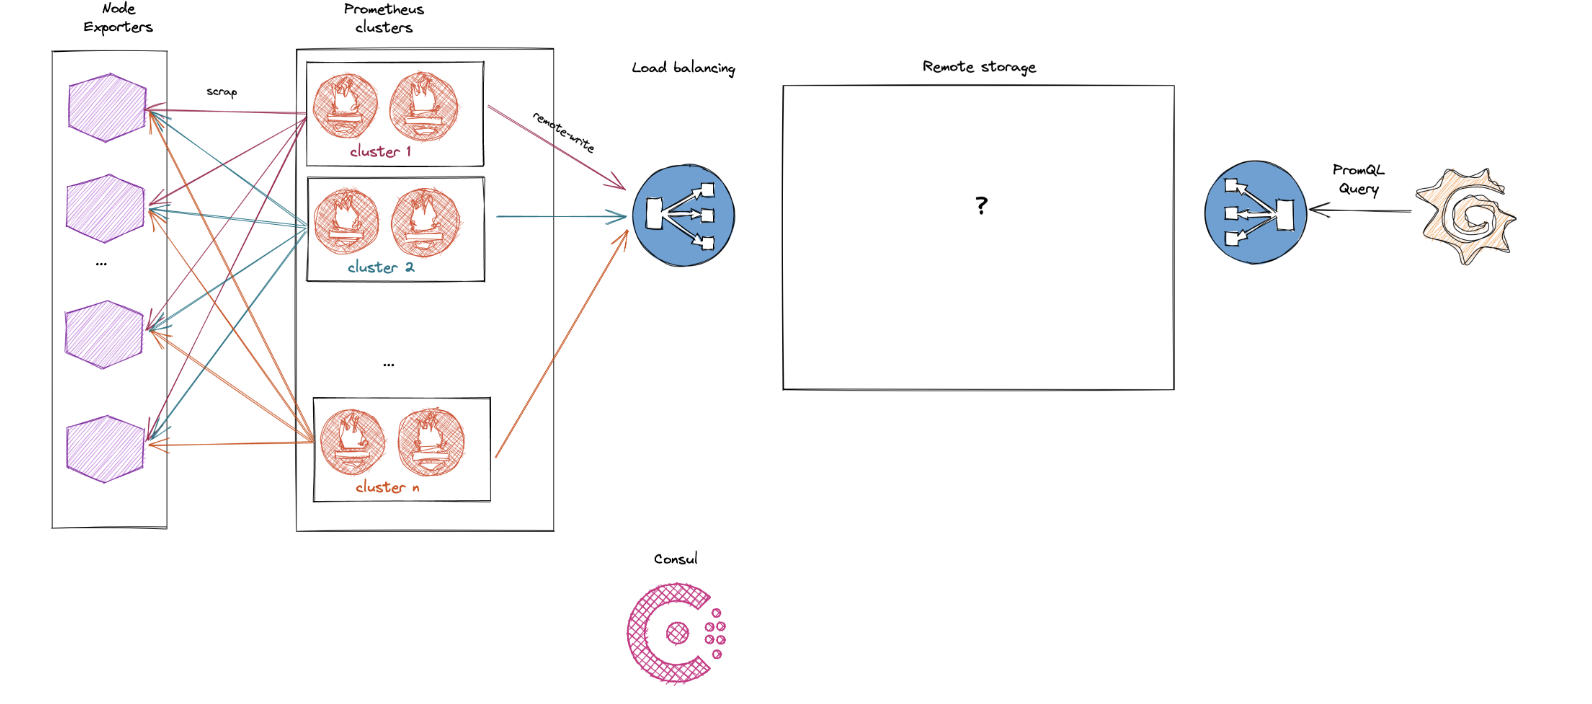
A monitoring and alerting system like Prometheus has local storage, which can be configured to retain data anywhere from a couple of hours to a usual default of about 15 days. On the other hand, remote storage allows for long-term data retention. The higher the retention, the more data is on disk. For companies that need to retain data for an extended period of time, a cost-effective solution is a remote storage provider, like Grafana Mimir. Prometheus can be configured to read or write to a remote storage on top of its local storage, allowing it to support long-term storage of user data. Learn more about Prometheus and remote storage in OVHcloud’s deep-dive blog post.
1. Be clear on your goals
To better address your unique technical challenges, you must pick the solution that has the necessary features. Here are a sample batch of features that we considered and that you might want to look for:
- multi-tenancy
- rate limiting
- deduplication
- deletion
- downsampling
For my team, which is core observability, our main mission is to provide a resilient observability infrastructure. There are many teams relying on us, and each of them has their own particularities so multi-tenancy is a must-have for us. We use it (and rate limiting) to prevent the “noisy neighbor” side effect. Grafana Mimir provides a lot of settings at both the cluster and tenant level to ensure one tenant doesn’t impact others or the quality of services.
Compliance is also a central issue. Since PromQL is the language used to query Prometheus, checking PromQL compliance is a key part in choosing a storage solution since it can impact result accuracy. Thankfully, the Prometheus community has addressed this question. (You can find compliance test results here.)
Ease of use was also a factor we took into account, and on the operational side, Grafana Mimir’s default settings are production ready.
2. Prioritize a strong community
While many remote storage options are 100% compliant with Prometheus, that world grows through adoption and is under active development. A solution that is compatible today may not be suited to our needs tomorrow. Since day one at OVHcloud, open source has been in our DNA. More than a philosophy, open source has been the way we have built our public cloud as well as the whole company. We don’t want to lock our customers into our cloud. We offer transparent and reversible solutions. It is only natural to apply this approach to the core of our internal decisions and infrastructure.
Which brings us to our second point: the community. How healthy, large, and active is the community behind the software? Is it easy to contact them and discuss issues? Can you propose features and pull requests (PRs)? We tend to take for granted the fact that PRs will be reviewed and that we’ll find someone to help us troubleshoot a bug, but that is not necessarily the case.
Grafana Labs has a vibrant open source community at your disposal. The documentation for Grafana Mimir, which is needed to facilitate the day-to-day care of Mimir, is written clearly, and you have their knowledge base at your disposal. You also have opportunities to contribute back. A definitive reason why we chose Grafana Mimir is Grafana Labs’ core values since they take open source as seriously as we do at OVHcloud. Their teams are welcoming, easy-going, and respond quickly in their Grafana Labs Community Slack.
3. Put it to the test
If you need multi-tenancy, check for that. If you need to downsample your data, add that to your checklist as well. It’s important to dig a little deeper and test a feature for its limitations. Tests are the only way to be able to make informed decisions.
Once you’ve selected a remote storage provider, it is important to undergo benchmark performance testing before putting it into production. Prometheus can be configured to read queries from data (remote_read) and ship samples to remote storage (remote_write) so you want to test both use cases. Below, we summarize our methodology, but if you’d like more detail, we outline our initial approach in this blog post on how to benchmark remote write storage and detail our original attempts in our blog post about how to benchmark remote read storage.
We learned a lot in our initial attempts, which we found were expensive, hard to reproduce, and focused mainly on the write path without stress from the read path, which is unrealistic. A good benchmark needs to be accurate and replicable, and our first efforts were too complex to achieve that.
We decided to use Grafana k6, an open source load testing solution, to focus on remote storage only. Since Grafana k6 is flexible and configurable, our results were replicable and our overall benchmarking infrastructure was simplified.
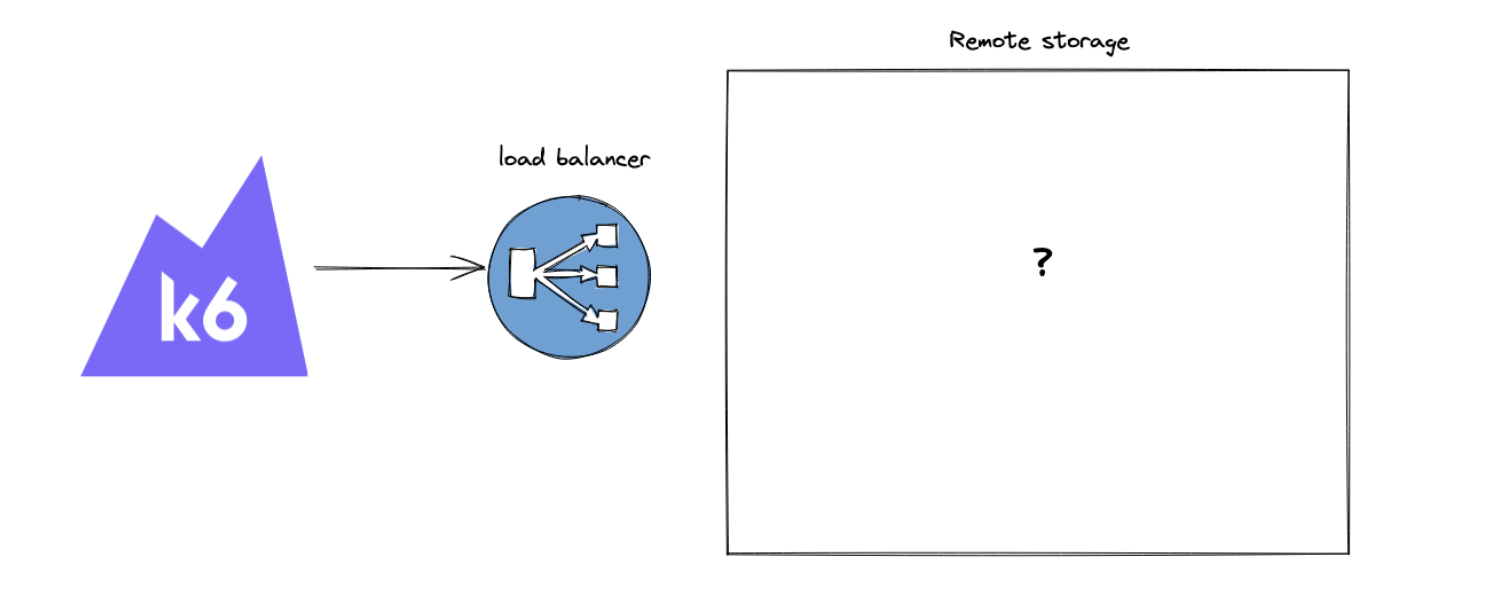
What a time saver! With k6, we were able to efficiently assess all remote storage solutions. This is a significant improvement if we compare these results to our previous benchmarking plan. We go into further detail in this blog post on how to benchmark Prometheus like a pro.
4. Weighing the costs
A big factor in any solution decision is total cost of ownership (TCO). For remote storage, you have to account for the infrastructure as well as the team operating the infrastructure. All technical solutions rely on four categories:
- trained engineers
- computing resources
- network
- storage
Like many cloud native technologies, Grafana Mimir relies on where the time series are stored. Doing so allows decoupling from the object storage and avoids the need to add more computing power or bigger disks for retention. Data in Grafana Mimir is also compacted to have the smallest storage footprint possible, which leads to cost efficiency gains.
5. Accounting for growth
Scalability is a necessary component of any infrastructure solution. How well does each remote storage scale? Can you write 2M samples/sec? Can you answer 1M queries/sec? Can you have 200M active series in total? Can you have 1B active series? Building a proof of concept will give you clear answers to the questions that are important to take into account for your company’s growth, and Grafana Mimir has the flexibility to scale with OVHcloud.
We can’t wait to see all the beautiful things our users will do with Mimir, and we’re excited to contribute back to the project and help Mimir thrive.
I would like to credit the team who worked with me on this adventure: Thank you Arnaud Sinays, Julien Girard, Nicolas Dupeux.
Grafana Cloud is the easiest way to get started with metrics, logs, traces, and dashboards. We have a generous free forever tier and plans for every use case. Sign up for free now!