

How one mobile company is using Grafana Enterprise for billing system observability and beyond
Calling or texting with a mobile phone may seem like a simple process, but behind the scenes, network providers are engaged in a constant exchange of transactions to pay each other for connecting their customers. If telecom companies don’t stay on top of the data and billing, they could be surprised with their own big bills at the end of each month.
Cosmote, the largest mobile network in Greece, handles the challenge by using Grafana Enterprise. With Grafana dashboards, the company is able to visualize business metrics, track revenue and expenses, and more.
Until about 2018, Cosmote’s billing department didn’t even have a monitoring tool. They would manually extract information from Cosmote’s Oracle database, put it into Excel, then plot on a table or graph. The scope was limited and the process was time consuming.
What made Grafana Enterprise the ideal choice was the Oracle plugin, which made it possible to visualize its billing data immediately. “It was no longer necessary to wait until the end of the month,” explains Nikos Mexas, a senior analyst responsible for the company’s billing systems.
Thanks to Grafana, Cosmote now has a centralized view of the company’s billing system, with SMS and email notifications alerting them to any signs of trouble related to expected income, future payments, or even fraud.
Calling all dashboards
In this dashboard, the billing team can look at traffic and rejected events (such as calls that weren’t completed) over several days. The data helps Nikos and his team know how much they can anticipate paying another telecom network for connecting calls.
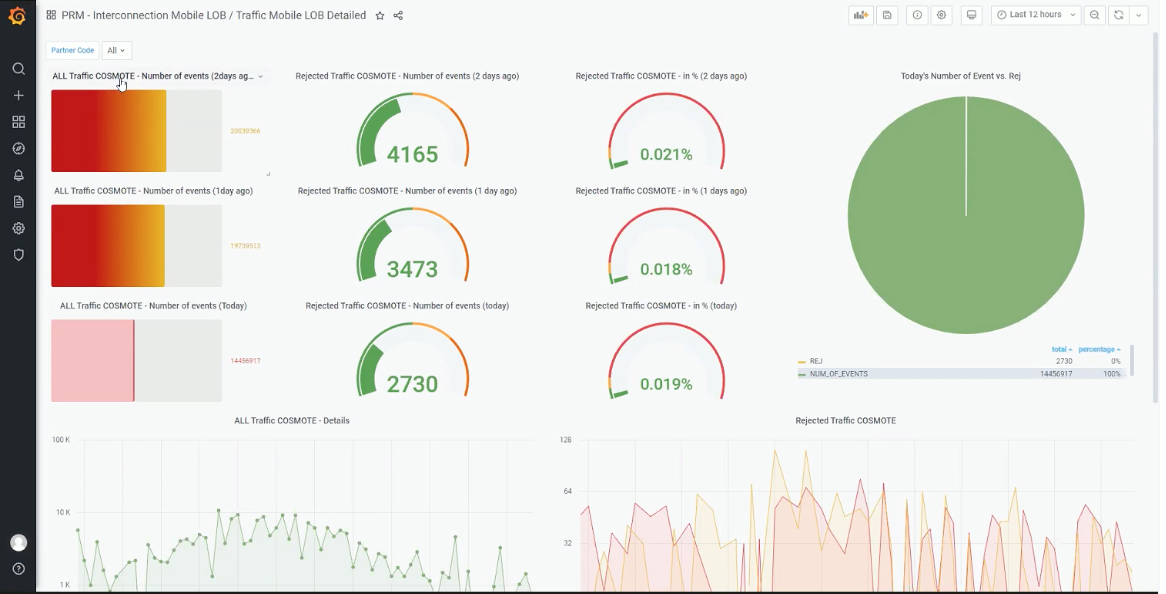
Cosmote’s Interconnection Mobile Line of Business Dashboard
Instead of running through, say, 4,165 records — and that’s just for one partner in one day — the team can just look at the percentage of rejected traffic and ensure it’s below that company’s SLA threshold, which covers required response times to both external partners and internal customers alike.
“This is something that I was not able to see before,” Nikos adds. “It was like I was in a cave, and this is my light. It’s such a big difference.”
Ringing success
Today, Cosmote’s billing team is no longer the only department using Grafana. Five high-level business and IT teams (including Billing Systems, Revenue Assurance, and Infrastructure) use the tool, with at least 35 people looking at dashboards.
With Grafana, Cosmote has even moved beyond its everyday financial and system monitoring tasks. During the coronavirus pandemic, as Greece and its neighboring countries rolled out their Covid-19 vaccination campaigns, SMS messages from the government were sent out on Cosmote’s mobile network. Cosmote was able to track in real time how many people were informed, then publish the dashboard to show how vaccinations were progressing for their customers.
Overall, Grafana has been a game-changer when it comes to helping drive Cosmote’s revenue, increase business, and give visibility to people around the company. “Grafana is a perfect tool for these purposes,” Nikos says.
To find out more about how Cosmote uses Grafana, check out their full success story here.
If you’d like to learn more about Grafana Enterprise, you can watch the “Getting started with Grafana Enterprise and observability” webinar on demand. You can also read more about Grafana Enterprise in the docs, and contact us if you’d like to try it out!


