KubeCon + CloudNativeCon EU recap: What you need to know about OpenMetrics
Before Prometheus, the closest thing to a common standard for metrics was Simple Network Management Protocol (SNMP), the internet standard protocol for collecting and organizing information and monitoring networks. Front and center in SNMP is ASN1, which lacks modern design and comes with trade-offs that made sense in the past but not so much today. Aside from that, many of the existing protocols were chatty and slow as well as proprietary, very hard to implement, or both.
Prometheus changed all of that. And now OpenMetrics, a working group dedicated to determining a standard for exposing metrics data influenced by the Prometheus exposition format, is pushing to evolve the ecosystem even further.
On Aug. 20 at KubeCon + CloudNativeCon EU, Grafana Labs Director of Community and OpenMetrics founder Richard “RichiH” Hartmann and Robust Perception’s Brian Brazil led an introduction to OpenMetrics, including how to rewrite your existing instrumentation, what’s needed to transition, and what’s needed to support your monitoring system.
How Prometheus changed the game
You can’t talk about OpenMetrics without talking about Prometheus.
Prometheus quickly became the de facto standard in cloud native metric monitoring and by extension, the same is true for the Prometheus exposition format.
“The ease of exporting this data has led to an explosion in compatible metric endpoints,” said Hartmann, who is also part of the Prometheus team at Grafana Labs. “We have thousands and thousands of exporters and integrations, which people wrote on their own because they wanted to get their stuff into Prometheus.”
Standard exporters and libraries also make integrating easy. “We even go beyond this by creating a standard exporter scaffold which you can use to write your own exporters and not focus on writing HTTP endpoints,” said Hartmann. “It’s so simple and so powerful.”
The same could be said for accessing and manipulating your data. “Label sets allow you to bring up a matrix of your data. If you need to slice and dice by customer, by deployment, by region, by version, it works great” said Hartmann.
Unlike a hierarchical data model which Hartmann said is “almost never fits your need” and is “basically broken as soon as you’re done defining it,” with label sets in Prometheus, “you can always access your data precisely as you need it as long as you have the labels for it,” Hartmann said.
OpenMetrics adoption progress
In introducing an open standard solution, “there’s always politics involved,” said Hartmann.
“A few vendors and projects had been torn about adopting something which carries the Prometheus name, especially more traditional vendors,” said Hartmann.
But since the project began in 2018, the OpenMetrics team felt it was important to have Prometheus at the forefront of implementing OpenMetrics and to reuse the installed Prometheus base for the ease of adoption as well as the sheer reach of the base.
It’s paid off. More than a dozen major tech companies are already interested in adopting OpenMetrics such as Google, Grafana Labs, InfluxData, and Uber.
“There are many different companies who helped shape OpenMetrics, so dare I say we actually achieved a neutral standard,” said Hartmann, who meets every two weeks with the OpenMetrics contributors to discuss the road map for the project.
As OpenMetrics evolves, the overall goal is to reject the kitchen sink approach and avoid trying to make OpenMetrics be everything to everyone.
“We want to follow the Unix mantra of doing one thing well, so we really remained focused,” said Hartmann. “Also to be honest, we are a bit opinionated about how to do things just because of a lot of experience.”
In addition to the “marathon runners” behind OpenMetrics – which include Hartmann and Brazil as well as Ben Kochie of GitLab and Rob Skillington of Chronosphere – Hartmann said, “we have had quite a few attendees from many different companies.”
Overall, Hartmann said, “we have a ton of commitments from people within companies who want to adopt OpenMetrics.”
How OpenMetrics works
The good news? OpenMetrics is largely the same as the Prometheus text format.
Even better, “it’s quite possible if you are using the official Prometheus Python client library that you’ve already been using OpenMetrics for a year and a half because the reference implementation is there,” said Brazil, who is also a core developer of Prometheus. “The general plan is that beyond the Python client, the other client libraries at some point will transparently migrate you to OpenMetrics without you noticing too. Everything will just work.”
But recently within OpenMetrics, “there have been a few cleanups, a few warts removed,” said Brazil. “And there are a few new features.”
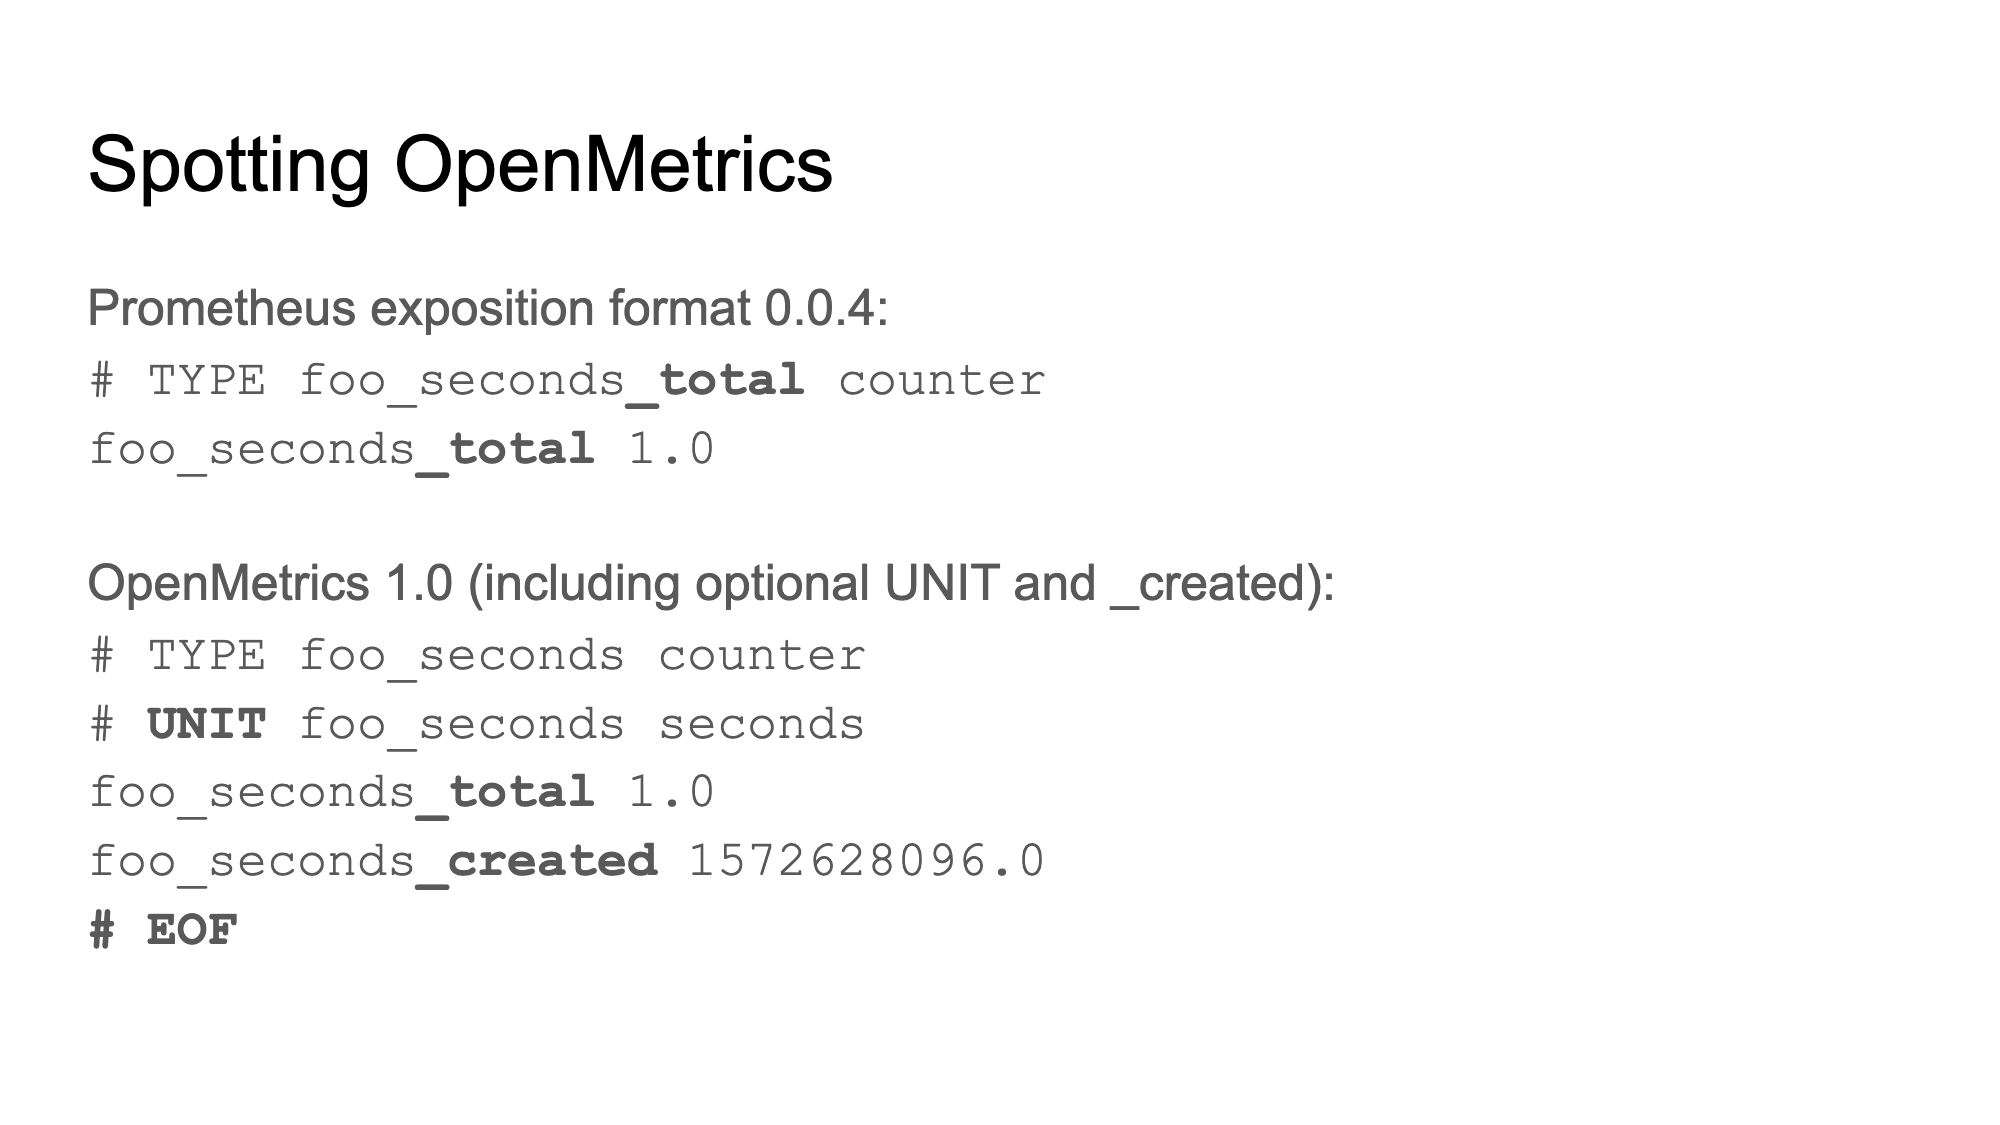
One of the biggest changes was to implement the convention for counters to end in _total, which is now mandatory on time series.
“If you are already following that convention, it will be a seamless change,” said Brazil. “If not, then when your client libraries switch, your metrics names are going to change. So this is something to get ahead of if you can.”
For example, if you have a metric called cpu_seconds, inside Prometheus it would end up being called cpu_seconds_total once it has migrated over.
Another recent change is that time stamps are now in seconds. “Because we use seconds everywhere in Prometheus we changed that for consistency,” said Brazil.
Other improvements and interoperability functions include:
- There is only one way of escaping rather than two.
- There are new ways to detect incomplete scrapes.
- There are higher resolution time stamps. “That was a request from Influx Data,” adds Brazil.
- There are 64-bit integer values.
_createdwas added for metric creation and resets. “This was a request from Google, and it handles some corner cases,” said Brazil.- There are considerations for both push and pull “to make sure OpenMetrics works for everyone,” said Brazil.
- The text format is still mandatory, but “historically Prometheus also had the protobuf format that went by the wayside with Prometheus v2.0,” said Brazil. So OpenMetrics reintroduced protobuf as optional.
What’s new in OpenMetrics
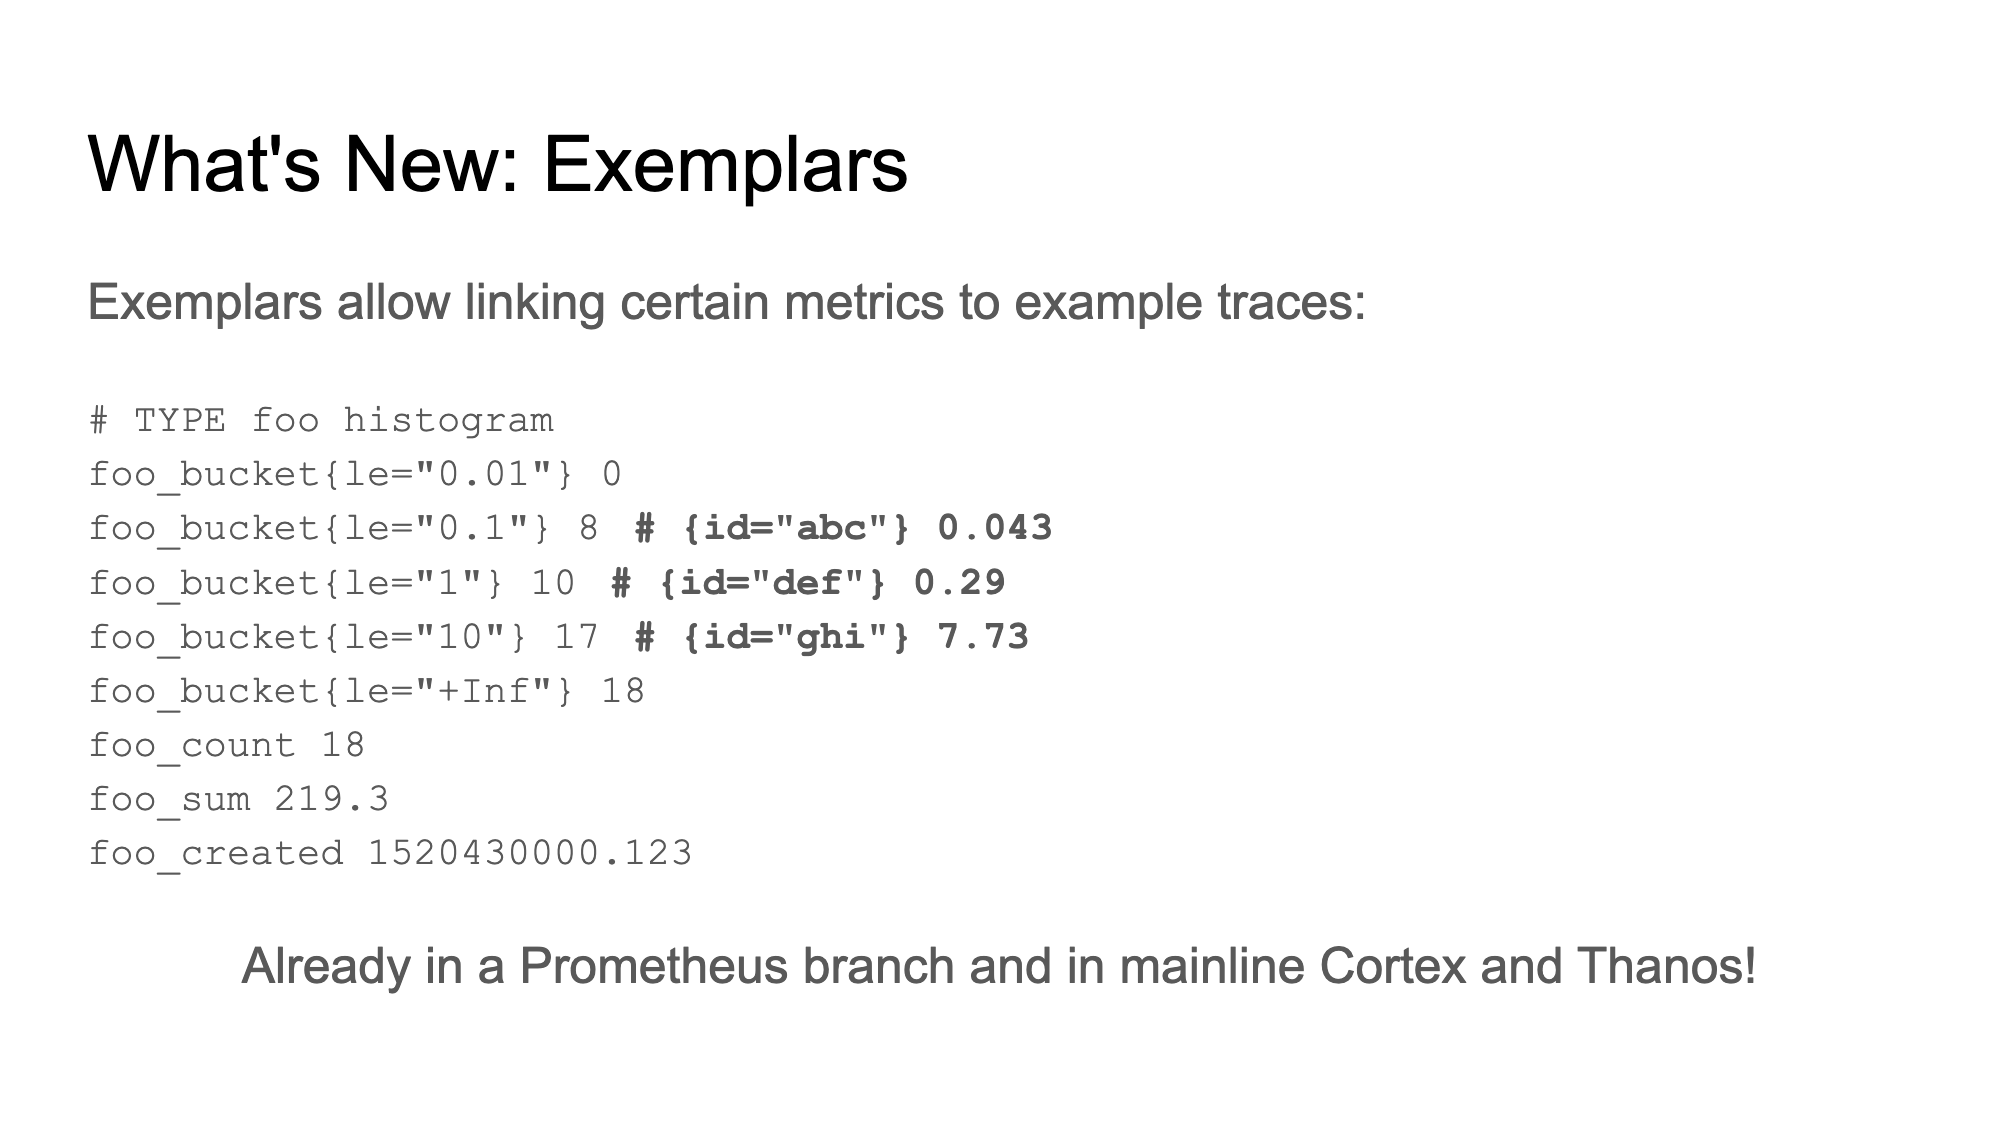
One of the biggest features that OpenMetrics introduced is exemplars to link certain metrics to example traces.
“Metrics are just one part of your monitoring solution. You’re also going to have logs and traces,” said Brazil. “The idea with exemplars is you can say, ‘I had just had this request that took a second in this particular histogram. Can I go and find that in my tracing system?’ And this is already supported directly in Cortex and Thanos and will likely be supported in Prometheus itself at some point.”

OpenMetrics + Prometheus—and beyond
As established, the link between OpenMetrics and Prometheus is strong. The Prometheus Python client is already the reference implementation for OpenMetrics, and it already incorporates the OpenMetrics data model internally. And since Prometheus v2.5, it will negotiate OpenMetrics preferentially when scraping.
In addition, the Go client has limited support to allow for exemplars.
Finally, info and enum are now first-class features. “These are conventions that came up over the years as different ways to represent strings,” said Brazil. “The handy thing with this is it all degrades gracefully. So even if you’re using info and enum, and you end up not negotiating OpenMetrics, you’ll still get them looking like gauges as they would in Prometheus today. So it’s all transparent.”
Because OpenMetrics is an open standard, other companies are ingesting it as well. “Today all the main metrics monitoring vendors, both commercial and noncommercial, support Prometheus text format,” said Brazil.
DataDog not only supports ingestion of OpenMetrics. The company also contributed performance improvements to the Python parser.
“Open Telemetry is also planning to support OpenMetrics as the first-class wire format,” said Brazil. “In some of the discussions we’ve had, we know OpenMetrics and Prometheus generally are helping to shape Open Telemetry.”
For those who are considering OpenMetrics, one note of caution: “If someone says OpenMetrics, there’s a good chance they actually mean the Prometheus text format,” warns Brazil. “There is some confusion there, unfortunately.”
The easiest way to spot the difference is to use the _total counter code change.

In the first example, there is an _total in the type line or on the actual time series. “In OpenMetrics, you’ll see it has a unit which is because it’s not part of the format and _total is not present,” said Brazil.
There’s also an example of _created, and it also has a #EOF at the end. So we know that the exposition wasn’t just interrupted mid-transfer.
How to transition to OpenMetrics
If you’re interested in OpenMetrics, there are three easy steps to keep in mind.
First, start by adding _total to your counter names.
“If you add this now and if you do it properly, you can actually control when you make the change. So we highly suggest you do this,” said Hartmann. (Though, for the record, all the client library integrations will handle this automatically for you.)
For those who are emitting data or having data scraped, Hartmann reminds you to ensure that you send in the correct Content-Type so Prometheus can see if it is actually an OpenMetrics or Prometheus text format.
Finally for those who are writing scrapers or ingestors, “please set ‘Accept Header’ accordingly so you can negotiate either Prometheus or OpenMetrics as needed,” said Hartmann.
The future of standardizing OpenMetrics
Since 2018, OpenMetrics has been operating in the background of Prometheus, but it hasn’t become the industry standard just yet.
“The implementation is a lot further than the standard,” said Hartmann.
Still there has been progress. The text format and protobuf specs are complete, but the document is still being compressed before submitting an Internet Draft for the Review for Comments (RFC) process and then IETF approval.
“We started with roughly 52 pages of pure spec,” said Hartmann. “Sixteen pages of those have already been compressed, and we have 36 pages to go.”
There have been other strides towards standardization.
There’s an official compliance test suite for parsers. “It’s based on the Python client library, and you can already use this for compliance testing to get ready for when this actually hits the ground running,” said Hartmann.
In addition to supporting OpenMetrics in all the official Prometheus client libraries, Hartmann said exemplar support is on a branch and waiting to go into mainline Prometheus. Finally, downstream projects such as M3DB, Grafana, and Loki can all make use of this new metadata.
Hartmann concluded the presentation optimistic about this effort finally coming to fruition not only in the background within Prometheus. He sees OpenMetrics across the wider ecosystem.
“It was always metrics, logs, and traces, in this order," Hartmann said. “OpenMetrics is standardizing what Prometheus does. Loki is the logical consequence of Prometheus. I am excited for what comes next, and what scales exemplars can enable.”
Read more about Prometheus within the Grafana Labs community and learn more about all the Grafana Labs talks at KubeCon + CloudNativeCon EU.
And if you want to work on and with Prometheus, Cortex, Loki, and our other projects, why not check out our open positions at Grafana Labs?
