Running a power plant with Grafana
A water and energy innovation company founded in 2005, Natel Energy builds hydropower turbines and designs resilient and distributed hydropower systems. In his talk at GrafanaCon EU, Natel Developer Ryan McKinley gave us a fascinating look at how the company is using Grafana to help run these next-generation power plants.
“It’s a different model for turbine than you’re used to seeing,” McKinley said. “Typically you’ve got a wheel that spins. [Our turbine aims] to capture more flow out of lower head sites, with the result of being able to have equivalent amounts of power production with less environmental consequences.”
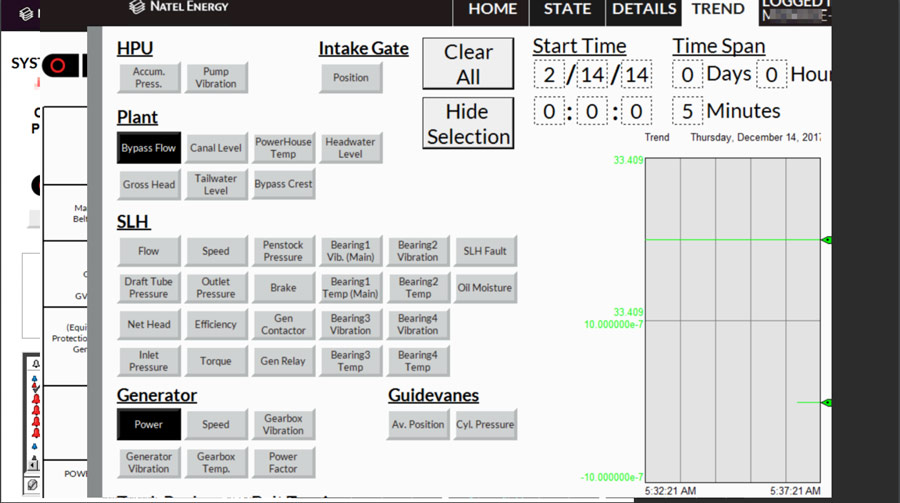
McKinley shared what the UI for one Oregon plant’s industrial controls looked like when he started at the company. “I don’t know if you guys have seen industrial control UIs, they start to look like this,” he said, pointing to page after page of charts. “OK, we need some buttons, let’s add some buttons to it. Oh here’s some more… Oh man. This thing’s kind of a disaster.”

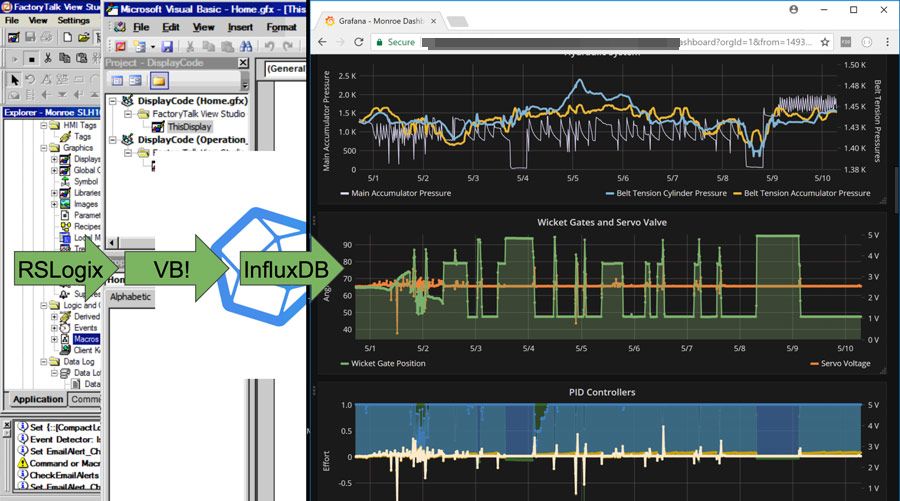
Working with the existing RSLogix system the company had in place, McKinley came up with a better solution. “You have to open up some Visual Basic, take Visual Basic, write it out to Influx, send it to Influx, then graph it to Grafana,” he said. “And everyone’s really impressed. Now you’ve got much easier-to-deal-with graphs.”

McKinley’s first Grafana project was a simple Ajax panel for the plant. “Here we’re showing we have a bunch of security cameras, showing the operation of the plant,” he said. “So let’s graph those along with what our hydraulic systems are doing while that’s going. Our team gets really excited about this, because previously we had this very expensive platform that would write to a SQL database, and people had to run a script and download that, run some processing, to be able to see what was happening. We replaced that with very simple things.”
Next, for data/performance analysis using non-time series data, McKinley created a Plot.ly panel that Natel has made available as a Grafana plugin. “For us, we care a lot about what’s the efficiency of our machine at different stages, so non-time series,” he said.
For a new plant in Freedom Falls, Maine, a remote site where internet connection is poor, McKinley had the opportunity to upgrade the whole control system and platform. “With the experience we had had with Grafana early on, I pushed a lot to really use Grafana as our UI,” he said. “So we essentially switched everything out.”
The new control system required remote monitoring and diagnostics, direct system control, and differentiation for expert and novice operators. Plus, “our needs keep changing all the time, so the dashboard as a platform was super useful,” he said. “Whatever needs you have are really easy to switch them around.”
One of the most popular Grafana graphs within Natel is one that tracks licenses for a solid modeling software package: “It shows you who’s got licenses checked out at a given time. There’s this button at the top that says, ‘I want that license’ and then it sends a Slack notice to everyone. People are pretty excited about that.”
Off-the-shelf there wasn’t a solution that could serve all of the new system’s needs, but McKinley was able to “tick off all the boxes” through Grafana’s powerful plugin infrastructure. And so Natel is contributing back to the open source community. “We have used Grafana all over the company,” McKinley said. “My goal has always been: Grafana has built some great tools for us. Our business is not building a graph, so let’s get it out there [to the community].”
See all of Natel Energy’s Grafana plugins.
Download the presentation slides.
