

Grafana 3.0 Stable Released
Grafana 3.0 Stable is now available for download! Over the past month we’ve been polishing features, fixing bugs and making sure everything is working the way it’s supposed to. We’ve been overwhelmed by the excitement and response around this release. See the features below to get a more in-depth look at what 3.0 has to offer, and check out what else we’ve been up to.
Release Highlights
- Big UI improvements and polish
- Redesigned plugin architecture and SDK
- Grafana-cli command line tool shipped with grafana, installs plugins
- Persisted dashboard playlists
- Preferences like home dashboard, timezone and theme on org and user level
- New plugin types, Apps, and Panels.
- New platform site built around Grafana at Grafana.net
- Plugin repository
- Dashboard repository (coming soon)
- Hosted Grafana and Hosted metrics (coming soon)
- Monitoring and backups of on-prem Grafana (coming soon)
- Annotation popovers can contain clickable links
- Templated data source Easily reuse the same dashboard for multiple data source instances
- OSX Homebrew support Homebrew installation instructions
- Support for InfluxDB 0.11+ (and new functions)
- Full changelog
Whats new in 3.0 Screencast
I have recorded a 19 minute long screencast that demos all the major new features in the release. But If you prefer to read then check out the What’s new in Grafana 3.0 article.
Commercial Support
We are here to help you succeed with your Grafana projects. Commercial support subscriptions for Grafana are now available.
- Get escalated access to core members of the Grafana development team; we’ll work with you to help you solve any Grafana issue quickly.
- Three tiers of production-level support, with increasing levels of response times and communication channels; pick the one that’s best for you.
- Unlimited incidents are available on every tier.
We are committed to a 100% open-source strategy for Grafana. If your organization finds Grafana valuable, please consider purchasing a subscription. Get direct support, bug fixes, and training from the core Grafana team.
Grafana.net
Grafana.net offers a central repository where the community can come together to discover, create and share plugins (data sources, panels, apps) and dashboards.
We are also working on a hosted Graphite-compatible data source that will be optimized for use with Grafana. It’ll be easy to combine your existing data source(s) with this OpenSaaS option. Finally, Grafana.net can also be a hub to manage all your Grafana instances. You’ll be able to monitor their health and availability, perform dashboard backups, and more.
Plugin showcase
Discovering and installing plugins is very quick and easy with Grafana 3.0 and Grafana.net. Here are a couple that I encourage you try!
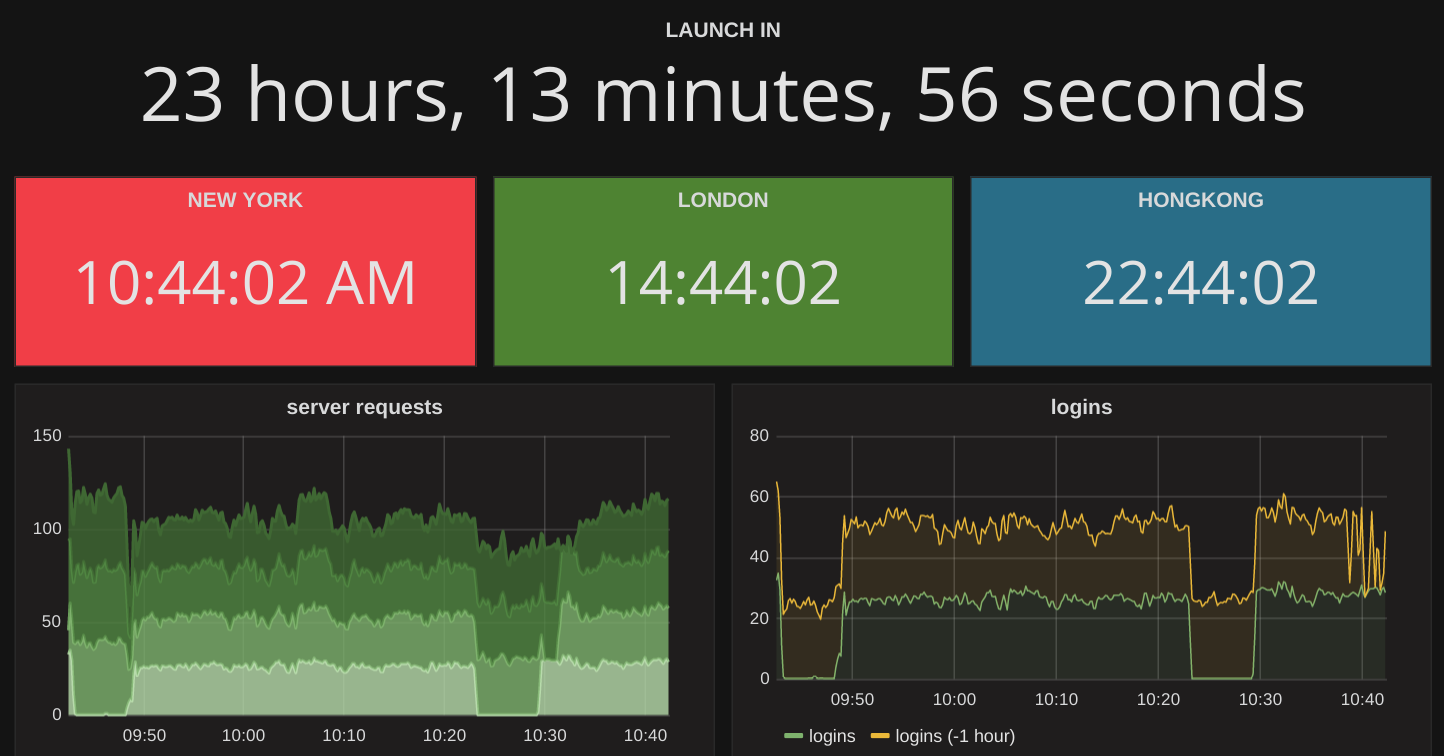
Clock Panel
Support’s both current time and count down mode.
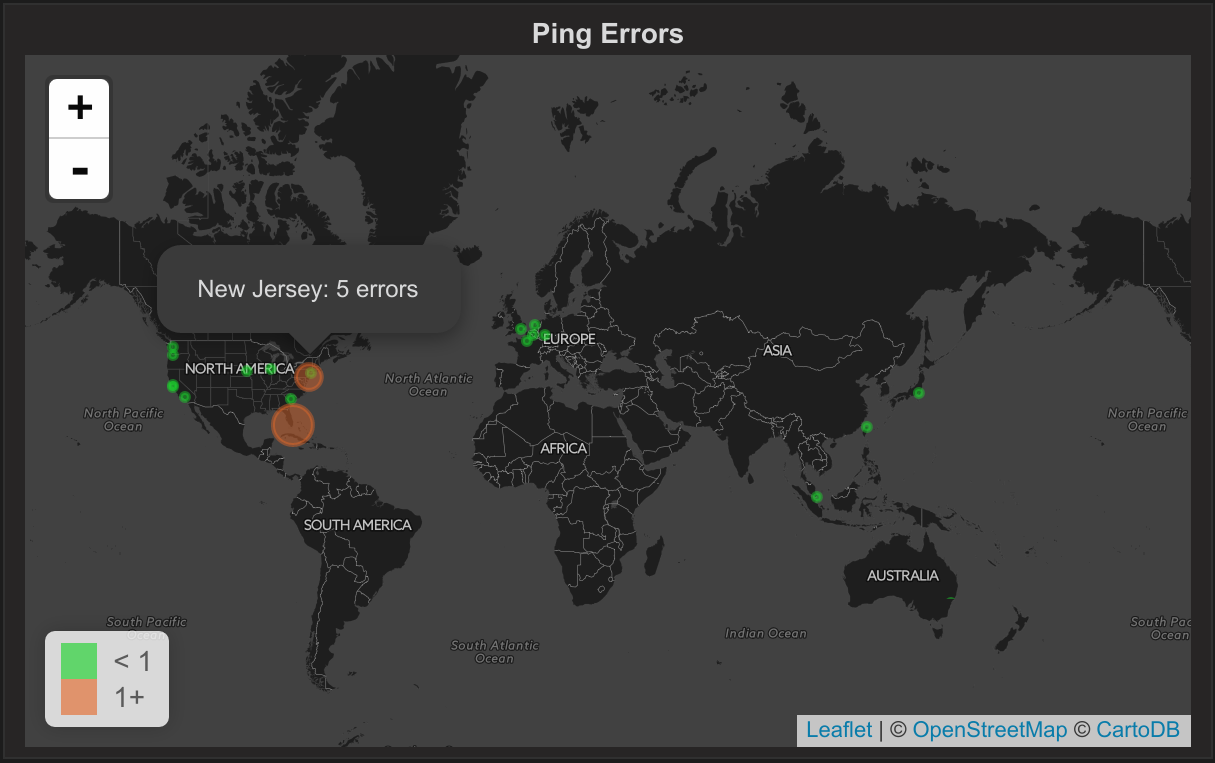
Worldmap Panel
Worldmap panel that can work with both regular time series (if you have country code in series name) and GeoHash codes that you can use with Elasticsearch’s GeoHash aggregation.
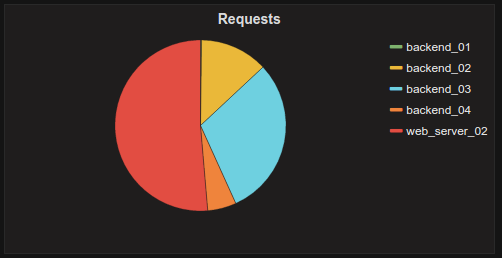
Pie Chart Panel
A simple pie chart panel is now available as an external plugin.
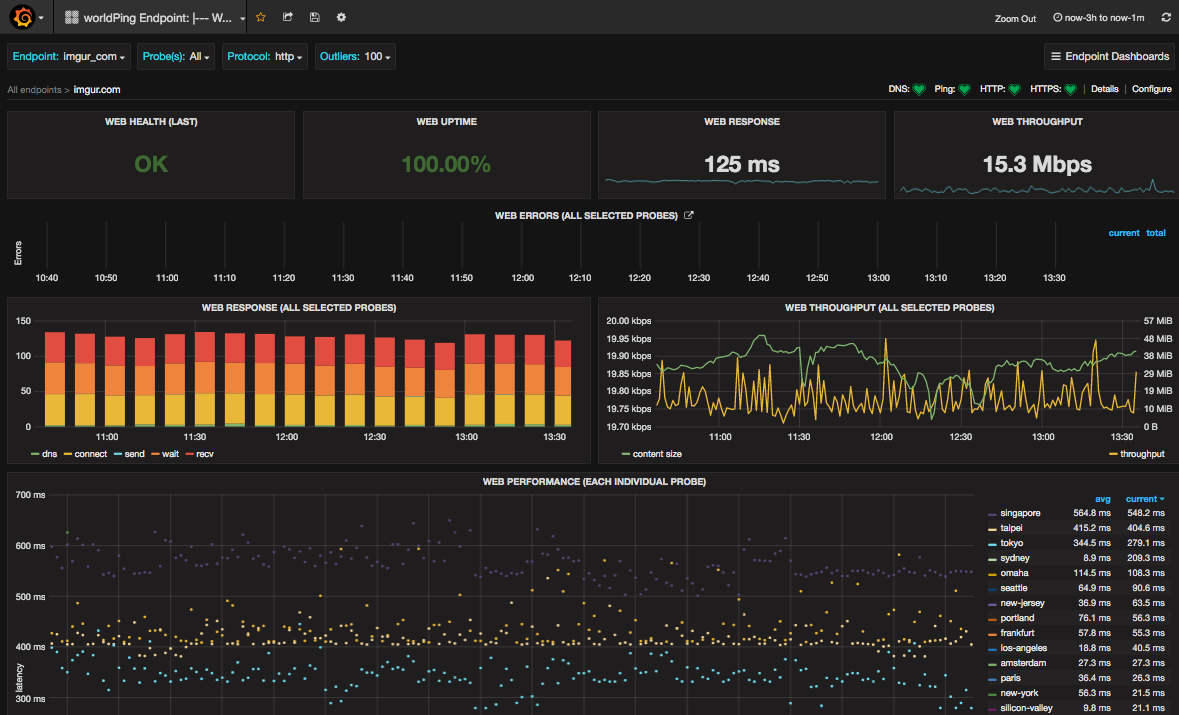
WorldPing App
This is full blown Grafana App that adds new panels, data sources and pages to give feature rich global performance monitoring directly from your on-prem Grafana.
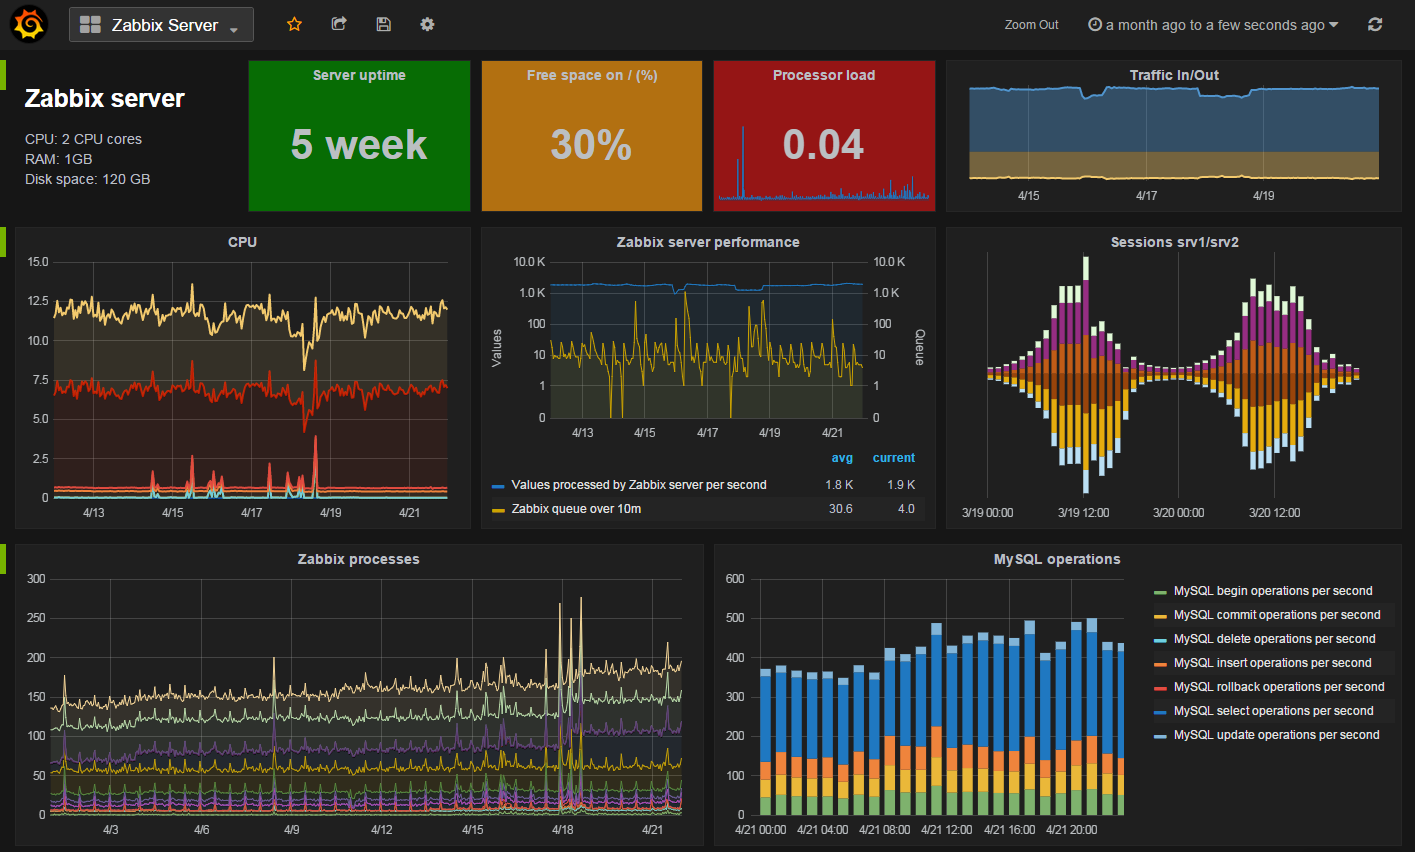
Zabbix App
This app contains the already very pouplar Zabbix data source plugin, 2 dashboards and a triggers panel. It is created and maintained by Alexander Zobnin.
Checkout the full list of plugins on Grafana.net
Upcoming webinars
Wednesday, May 18 - 1:00pm EDT
Deconstructing the New Plugin Architecture in Grafana.
Matt Toback will take a deep dive into the new plugin architecture in Grafana 3.0 and how to use Grafana.net to extend your panels, data sources and even introduce new applications.Register Now
Wednesday, May 25 - 1:00pm EDT
Deconstructing the New Plugin Architecture in Grafana.
Matt Toback will take a deep dive into the new plugin architecture in Grafana 3.0 and how to use Grafana.net to extend your panels, data sources and even introduce new applications.Register Now
Thanks
A big thank you to everyone who helped test and report issues with the beta release.


