

Grafana 2.0, the future, and raintank
This is a semi long blog post about my experience working on Grafana during 2014 and the plans for 2015. So if you want to skip the personal & history stuff jump to the end for some news and plans for 2015.
In the beginning
Grafana has now been in development for a little over one year. The first commit dates to Dec 5 2013. It started just as a late night hack trying to get Graphite to work with the histogram panel in Kibana. I had just started using Kibana at work and fell instantly in love with it. It was just so awesome at analyzing logs and its beautiful dark UI made it easy to build dashboards without having to manually edit json files. Something that many alternative Graphite dashboards required.
My late night Kibana + Graphite hack worked so well that I quickly started imagining my dream Graphite dashboard and graph composer and spent almost all of Christmas 2013 working non stop on realizing those initial ideas. Ideas like a full screen graph edit mode and an intelligent Graphite expression builder that makes graphite expressions more readable, editable and understandable. Of all the features in Grafana, I am most proud of the Graphite expression and function editor.
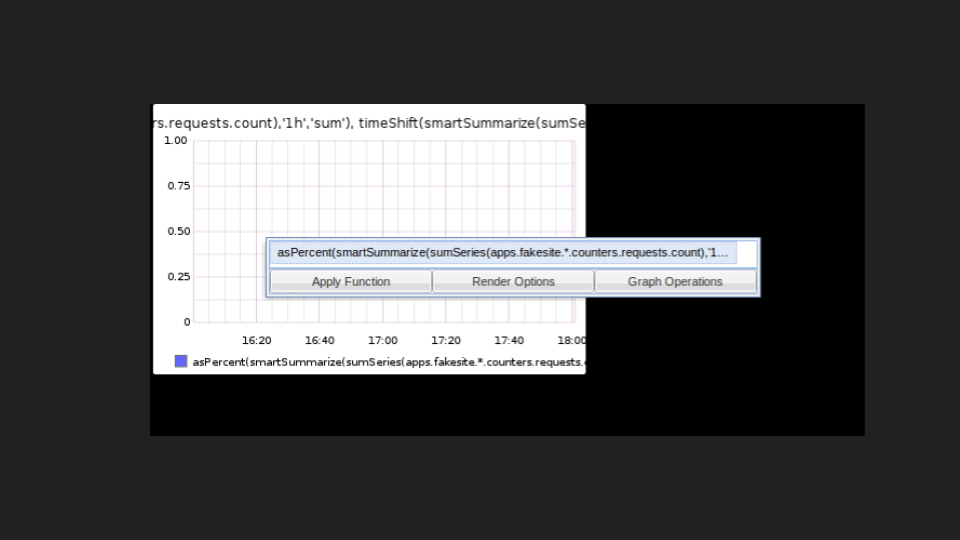
The graphite query editor, showing the same query in text edit mode and in the Grafana graphite editor mode
I did not really expect much when I first released Grafana 1.0 on January 19th. There was such a plethora of other Graphite dashboards, so who would care about yet another one? Boy was I wrong. The reaction was really amazing. That evening after the first release Grafana went “mini” viral within the Graphite community and my phone buzzed constantly for about 40 minutes from all the retweets!
All the positive reaction gave me a lot energy and the will to spend most of my free time on Grafana during winter and spring 2014. I used to come to work at 7am to be able to squeeze in an hour on Grafana before having to start doing “real work”.
Monitorama May 2014
Jason Dixon (@obfuscurity), one of the main developers on the Graphite project, invited me to speak at the Monitorma conference in Portland (a GREAT monitoring conference that is organized by Jason). I got a chance to meet and talk to some great people, like Jason, Luke Kanies, Paul Dix from InfluxDB, Dave Concannon from Hosted Graphite, and many others.
The reaction to my talk and from the many attendees that came up to me to express their love and thanks for Grafana was really amazing. There is going to be another Monitorama in June 2015, see you there!
Full time work
By the end of April I was itching to work on Grafana full time. There were so many potential improvements and so little time. So I decided to quit my contracting work after the summer and start working on Grafana full time. I had some savings in my company that would last me about a year so I figured that it could be fun year working on open source. I also planned to explore options to commercialize Grafana or seek sponsorships. Summer went and so did autumn. I had a blast working on Grafana full time, releasing some pretty big improvements in v1.7 and v1.8. User adoption kept on growing, as did user feedback and contributions. I also managed to get some sponsors!
Contributions and Sponsorships
A special thanks to all who have contributed to Gafana during last year in terms of pull request contributions, feedback on github and IRC. A special thanks goes to Grafana’s sponsors: Squarespace, Dreamhost and Demonware for helping support full the time work on Grafana.
Grafana in 2015
When I started working on Grafana full time I also started working on a Grafana backend. I figured that a Grafana backend that could do authentication, server side rendering of panels, integration with hipchat & slack, alerting etc could be a “Pro” version that I could charge money for. I did not spend much time on this backend as there was so much I wanted to get done in the frontend so it never saw the light of day in 2014.
Raintank
There are no longer any plans for a closed source or commercial version of Grafana. The backend powered version will be 100% open source. What is making this possible is Grafana’s sponsors and a company I am co-founding together with Raj Dutt (founder of Voxel) and Anthony Woods. The company is called Raintank and will focus on building and providing a SaaS platform around open source metric and monitoring solutions (Grafana is one among them). This SaaS platform will be completely open source.
We have assembled a great team with a lot of engineering and design talent that will, among many other things, accelerate Gafana development and strengthen the open source monitoring community.
Grafana 2.0
So the good news is that there will NOT be any splintering of the Grafana user community into Pro/Enterprise users and OSS users. There will just be one open source Grafana codebase and variant. There will continue to be a standalone build for users who prefer the pure frontend nature of Grafana. The Grafana frontend architecture has been slightly redesigned to work in both standalone and backend mode. In backend mode it will utilize the backend for saving and searching dashboards, as well as a number of views that will be enabled (login, admin, etc).
The features that the backend will enable in Grafana 2.0 will initially be:
- Integrated dashboard & user database (sqlite3)
- Can also use mysql or postgres as database
- Multi-tenant user accounts and authorization (can be disabled)
- User & password
- GitHub OAuth
- Google OAuth
- LDAP integration
- Server side rendering of panels to PNG images
- Easy admin UI for data sources (can also be configured via config file)
- Integrated data source http proxy for all datasources (to work around CORS issues)
- HTTP API
- Migration script for dashboards stored in Elasticsearch or InfluxDB
This is the very basic set that we are aiming for right now. There will probably be a lot of enhancements in the existing dashboard and panel features and the initial release will be quickly followed by more advanced features like integration with hipchat, slack & hubot, user preferences and eventually alerting.
Grafana 2.0 is currently not ready for a alpha or beta. But the code and a preview version will be made public shorty, hopefully within 2-3 weeks.
Other news
- Grafana 1.9.1 was released two weeks ago (in case you missed this)
- Grafana now has a user and developer mailing list. Subscribe here
- Graphite 0.9.13-pre1 has been released! Read the release notes.
- The Grafana plugins repository has seen some activity lately with updates for the KairosDB datasource and a basic implementation for an Atlas datasource (the Netflix metrics db).


